Figure 3.
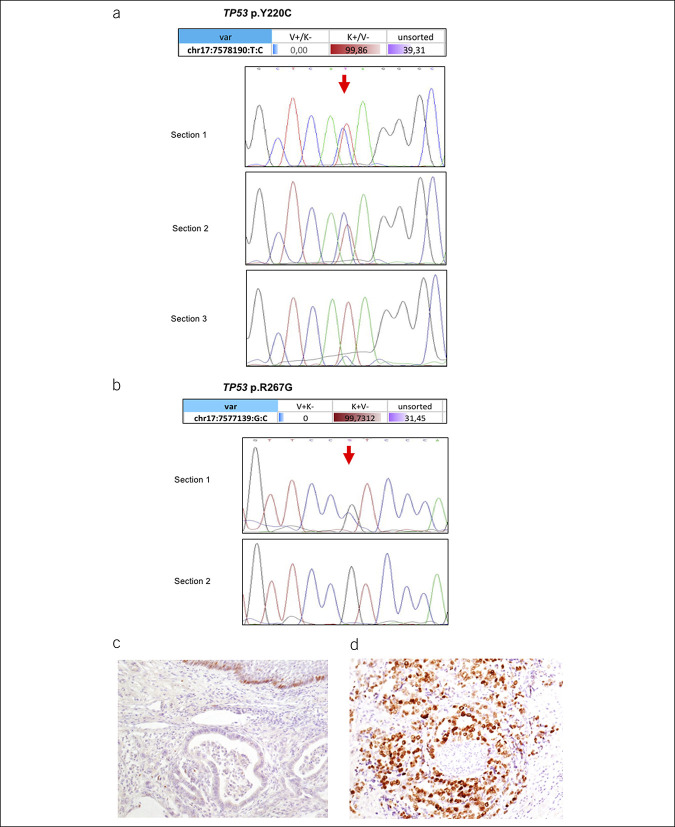
Tumor protein 53 (TP53) mutations and correlation with expression in EAC. (a) TP53 p.Y220C mutation in the sorted pure populations of tumor cells (red), stromal cells (blue), and unsorted cell fractions (violet). Values represent the alternative allele frequency (upper panel). Lower panel: Sanger sequencing of DNA isolated from 3 different tissue sections of the same tumor tissue block, showing the presence of the mutation as a heterozygous change in only sections 1 and 2 (red arrow). (b) TP53 p.R267G mutation in the sorted pure populations of tumor cells (red), stromal cells (blue), and unsorted cell fractions (violet). (c) Immunohistochemistry indicating low p53 protein expression in a case with a normal p53 gene status (hematoxylin was used as a counterstain). (d) Immunohistochemistry for p53 in a case of gene mutation and protein overexpression.

