. 2020 Sep 22;9:e58142. doi: 10.7554/eLife.58142

Figure 2. Physiological trajectories in (A) Lactate, (B) systolic blood pressure, and (C) heart rate for the 4 clusters of patients illustrated in Figure 1.

Solid lines indicate the mean value of each feature within each cluster. Shaded areas indicate an interval of 1 standard deviation from the mean.

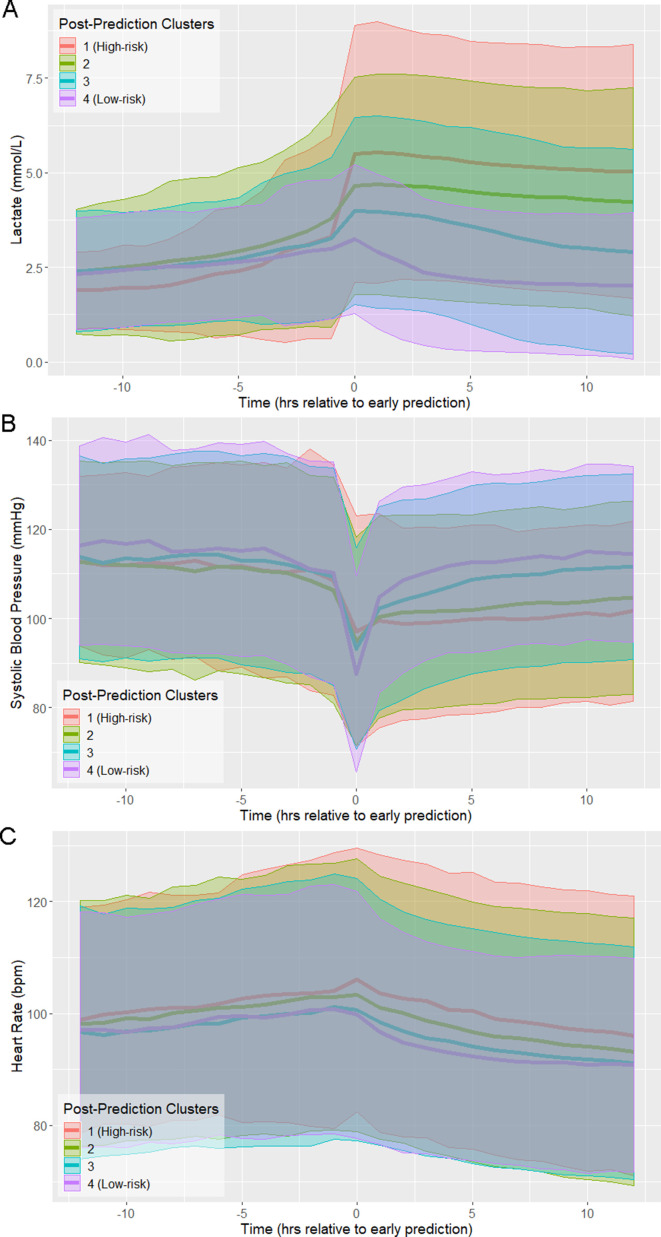
Figure 2.

Figure 2—figure supplement 1. Kullback-Leibler Divergence of Risk Score and physiological variables between the highest-risk and lowest-risk clusters in the window surrounding early prediction.

Figure 2—figure supplement 1.

Figure 2—figure supplement 2. Physiological trajectories in (A) Lactate, (B) systolic blood pressure, and (C) heart rate for the 3 clusters of patients illustrated in Figure 1—figure supplement 3 in the MIMIC-III database.

Figure 2—figure supplement 2.

Solid lines indicate the mean value of each feature within each cluster. Shaded areas indicate an interval of 1 standard deviation from the mean.

Figure 2—figure supplement 3. Kullback-Leibler Divergence of Risk Score and physiological variables between the highest-risk and lowest-risk clusters in the window surrounding time of early prediction in the MIMIC-III database.

Figure 2—figure supplement 3.