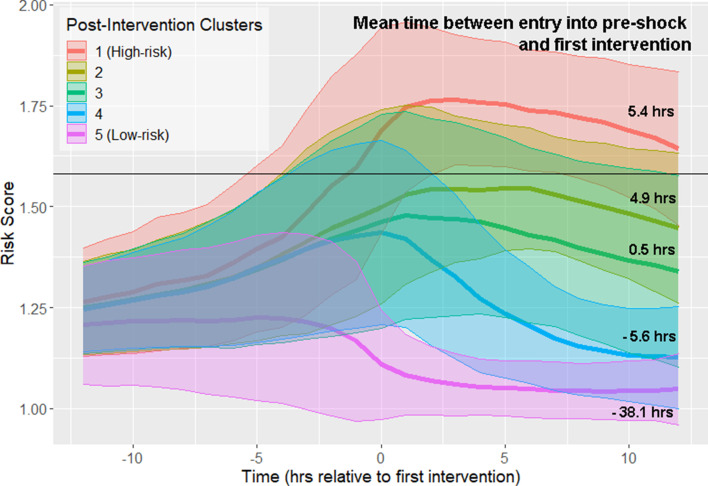
Figure 4. Risk score trajectories following the first instance of intervention.
Threshold for early prediction is indicated by the horizontal line. Bold lines indicate mean risk within each cluster. Shaded areas indicate one standard deviation from the mean. The mean time within each cluster between entry into the pre-shock state and the time of first intervention is indicated on the right-hand side of the figure. A positive number indicates that the time of first intervention is after the time of threshold crossing, whereas a negative number indicates that the first intervention precedes entry into pre-shock.


