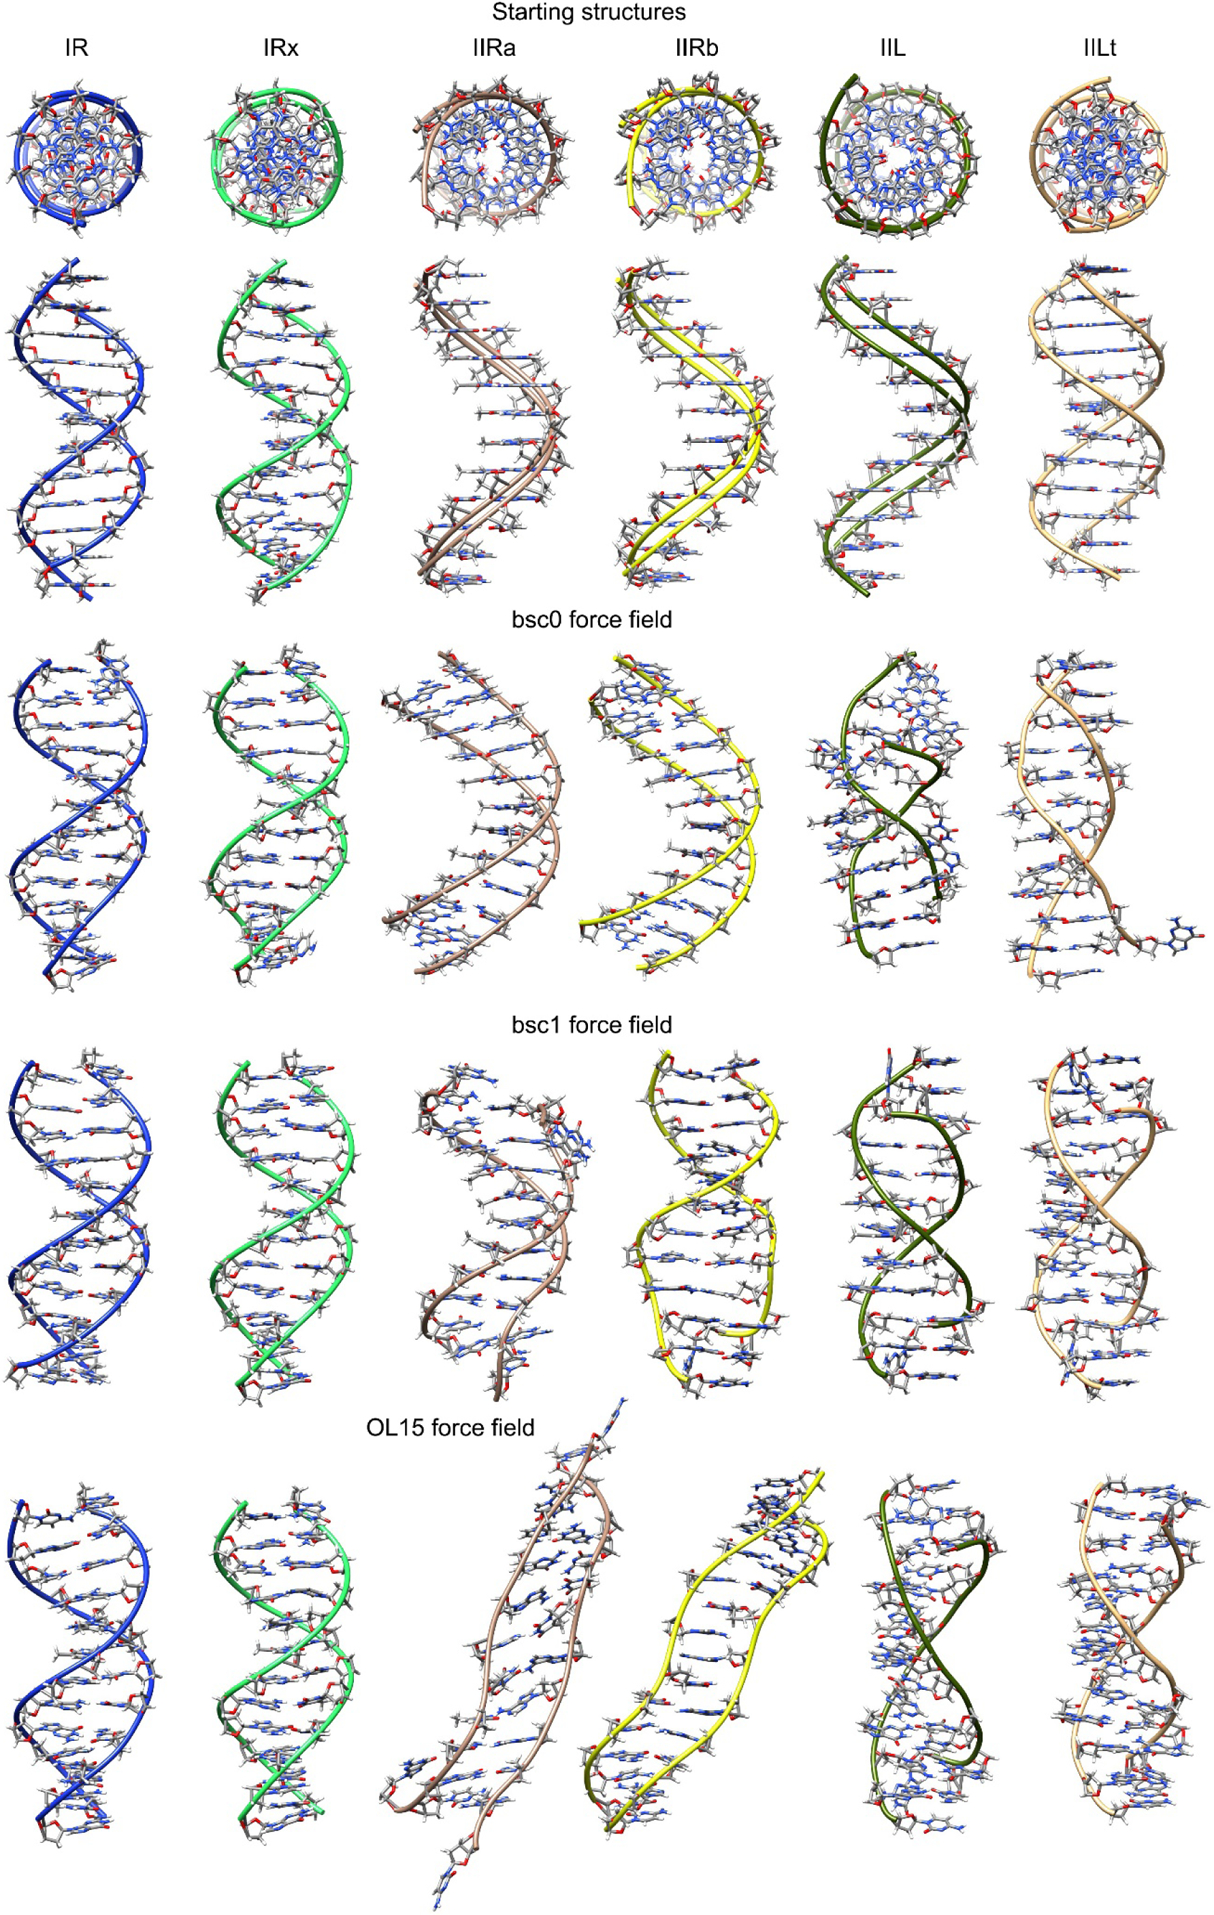
Figure 1.

Top: initial constructed structures used in this study shown in two perspectives. Under these are structures for each force field showing the representative structure from the most populated cluster over all the frames from the five independent sampled trajectories. Refer to the on-line article for the color version of the image.
