Figure 2:

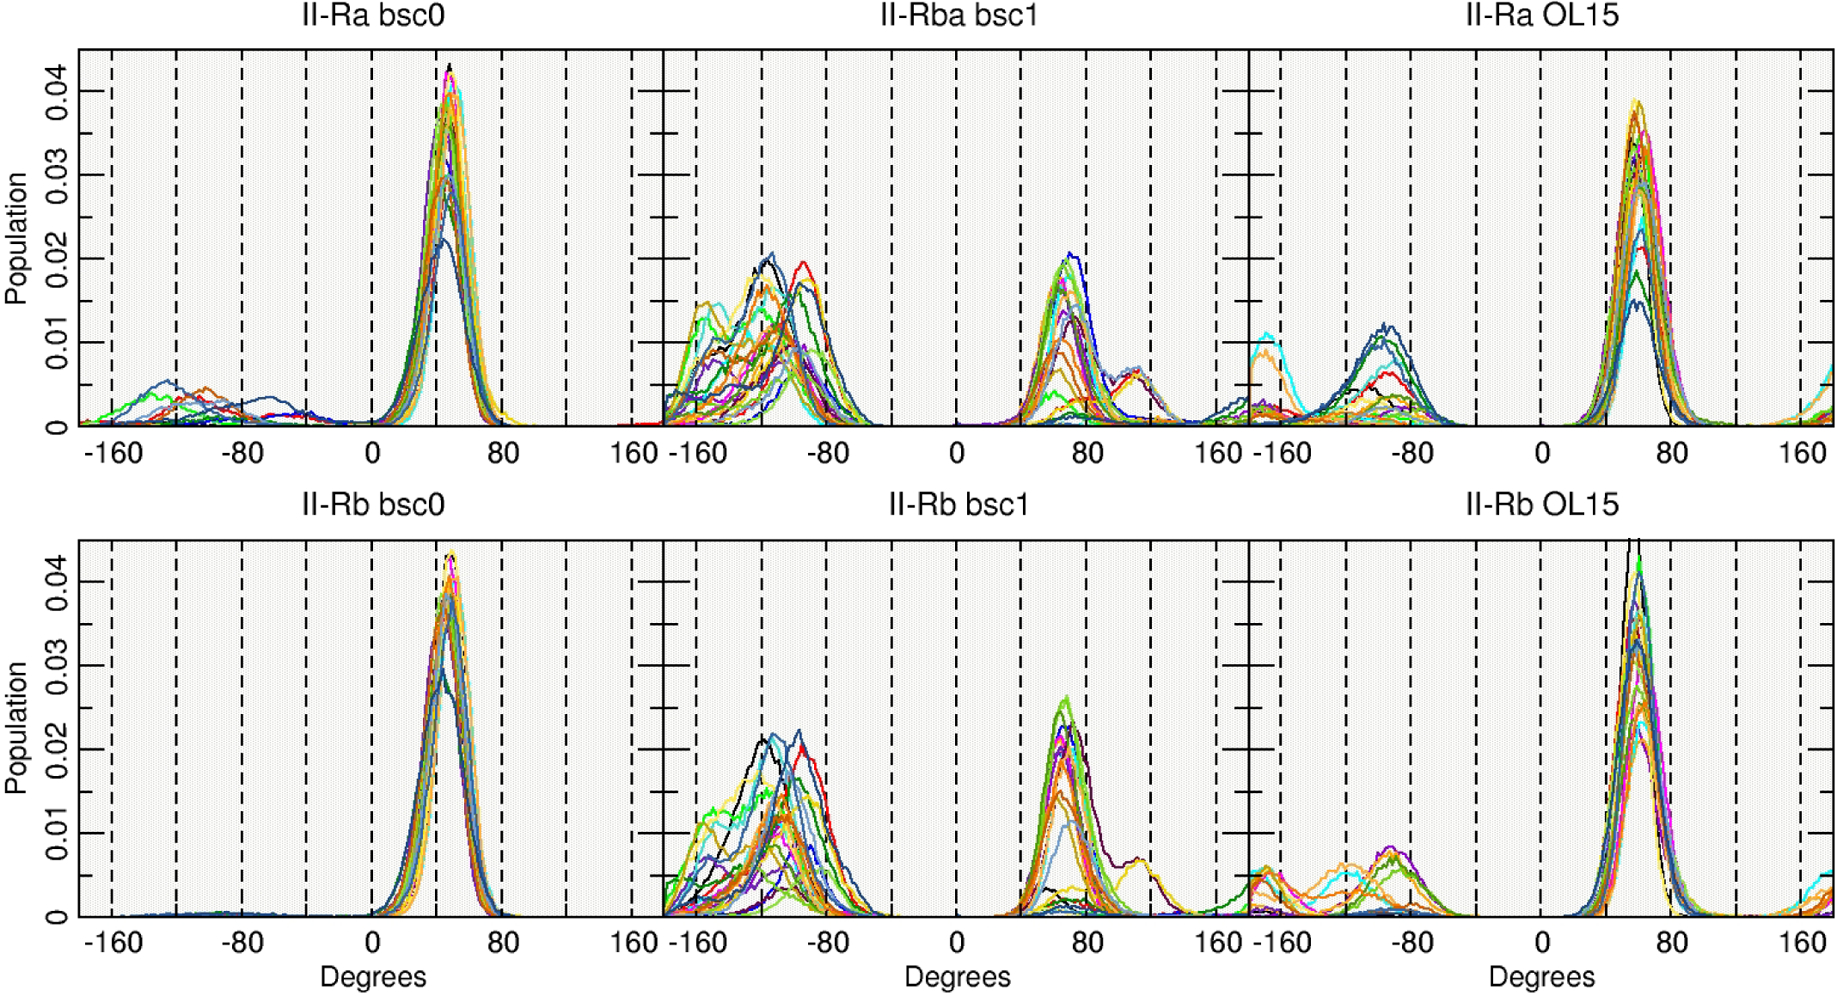
Population histograms of the values for the χ angle using the entire aggregated trajectory. Each line represents one base out of the 24 present on the DDD.

Population histograms of the values for the χ angle using the entire aggregated trajectory. Each line represents one base out of the 24 present on the DDD.