Figure 3:

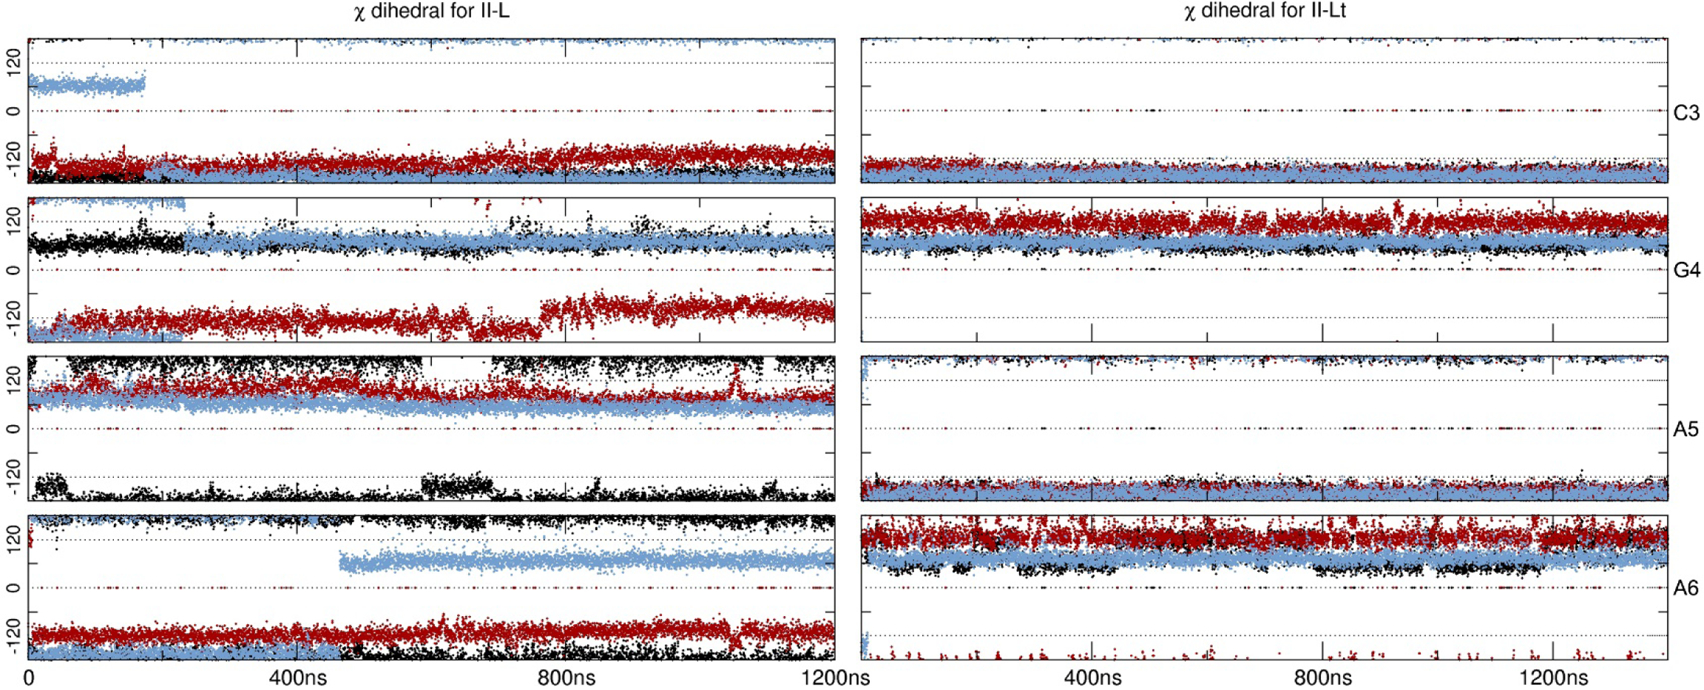
Glycosidic angles (in degrees) for the inner residues CGAA. Black represents bsc0, red is bsc1 and blue is OL15. Only the very first 1200 ns are shown of the first copy.

Glycosidic angles (in degrees) for the inner residues CGAA. Black represents bsc0, red is bsc1 and blue is OL15. Only the very first 1200 ns are shown of the first copy.