
Table 1:
Name and description of the systems used in this work.
| Name of the system | Description | Starting structure example (only central base pairs shown, hydrogen atoms hidden for clarity, red is oxygen, blue is nitrogen, orange is phosphorous and grey is carbon atoms). |
|---|---|---|
| I-R | This model was constructed from idealized cylindrical coordinates based on X-ray fiber diffraction data(Arnott, Campbell, & Chandrasekaran, 1976). (rise = 3.38 Å, twist = 36.0°). | 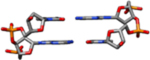 |
| I-Rx | These coordinates are directly from the analysis of the 1.4 Å resolution single crystal X-ray diffraction data of the PDB entry code 355D(Shui, McFail-Isom, Hu, & Williams, 1998) (mean rise 3.29 Å, mean twist = 35.4°). |  |
| II-Ra | Theoretical cylindrical coordinate data of a DNA form having bases perpendicular to the helix axis was used to build this model (rise = 3.4 Å, twist = 34.6°). | 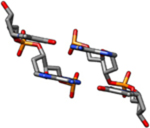 |
| II-Rb | The coordinates for this model are similar to the II-Ra coordinates above but with C2’-endo sugars, rather than C4’-exo (rise = 3.4 Å, twist = 34.6°). | 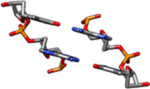 |
| II-L | This model was constructed from theoretical cylindrical coordinates of a DNA form having bases perpendicular to the helix axis(Alexander Rich & Zhang, 2003). | 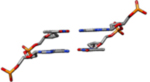 |
| II-Lt | Coordinates for this model were built from theoretical cylindrical coordinates of a left-handed form of DNA designed to satisfy B-DNA fiber diffraction constraints(Gupta, Bansal, & Sasisekharan, 1980). Bases are tilted relative to the helix axis. (rise = 3.4 Å, twist = −36.0°). | 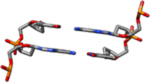 |