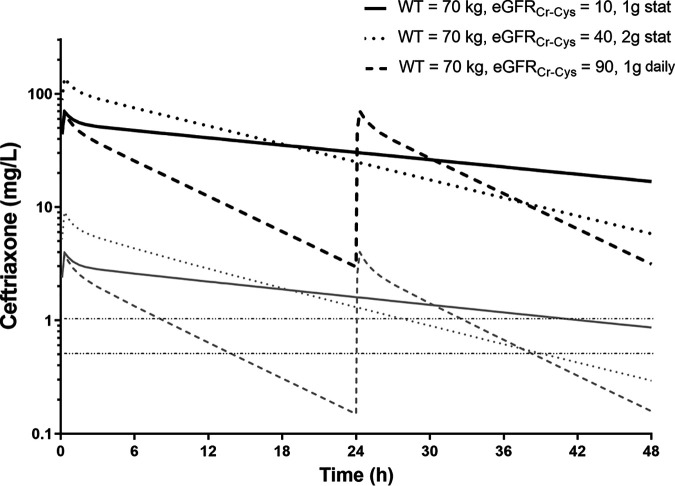
FIG 4.
Results of simulations at steady state demonstrating time-concentration profiles for ceftriaxone given every 48 h in patients with severely impaired renal function (black solid line; 1-g dose) and moderate renal impairment (black dotted line; 2-g dose) compared with normal renal function (black dashed line; 1 g every 24 h). The corresponding gray lines represent simulated free concentrations over time and are presented in relation to target breakpoints for Escherichia coli (1 mg/liter) and Streptococcus pneumoniae (0.5 mg/liter). stat, single dose only.

