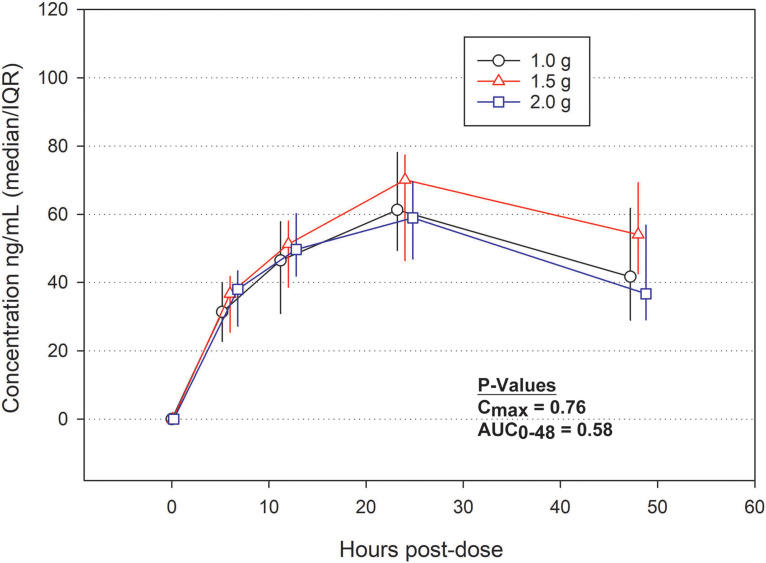
FIG 2.
Pharmacokinetic data from the EnACT (encochleated oral amphotericin for cryptococcal meningitis) phase IA study. The median AUCs from time zero to the last quantifiable concentration in the plasma of the cohorts receiving doses of 1.0 g, 1.5 g, and 2.0 g were 1,970 ng · h/ml (IQR, 1,660 to 2,480 ng · h/ml), 2,660 ng · h/ml (IQR, 1,940 to 2,910 ng · h/ml), and 2,180 ng · h/ml (IQR, 1,790 to 2,630 ng · h/ml), respectively. The median cAMB plasma concentrations at various time points are visually displayed in the line graph. No statistically significant differences in Cmax or AUC were found between groups. Error bars represent the interquartile range for each cohort. The P values were calculated by the Kruskal-Wallis ANOVA. Abbreviations: AUC0-48, area under the curve from 0 to 48 h; Cmax, maximum concentration in plasma.

