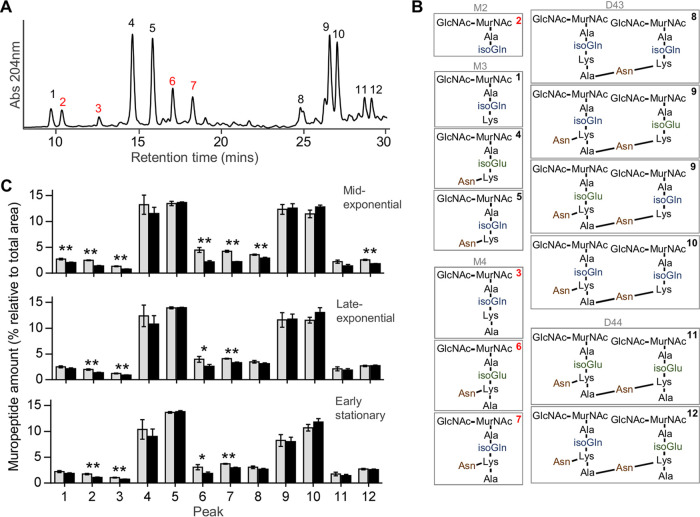
FIG 4.
Peptidoglycan modifications produced by caspofungin exposure. (A and B) Representative UPLC chromatogram of E. faecium Aus0004 peptidoglycan of a nontreated sample (A) and structure of the muropeptides determined for each indicated peak that was confirmed by MS analysis (B) (M, monomer; D, dimer; the numbers refer to the length of the stem peptide). Peaks representing significant changes after caspofungin treatment are labeled in red. (C) Quantification of the abundance of the muropeptides determined under two sets of growth conditions: tryptic soy broth (TSB) (gray bars, untreated samples) and TSB plus caspofungin 8 mg/liter (black bars, treated samples). The experiment was realized at 3 different times of growth (mid-exponential phase, late-exponential phase, and early stationary phase). Statistical analysis was performed using Student's t test. Asterisks represent significant P values from comparisons of treated samples to untreated samples (*, P < 0.05; **, P < 0.005). Each experiment was performed in triplicate.

