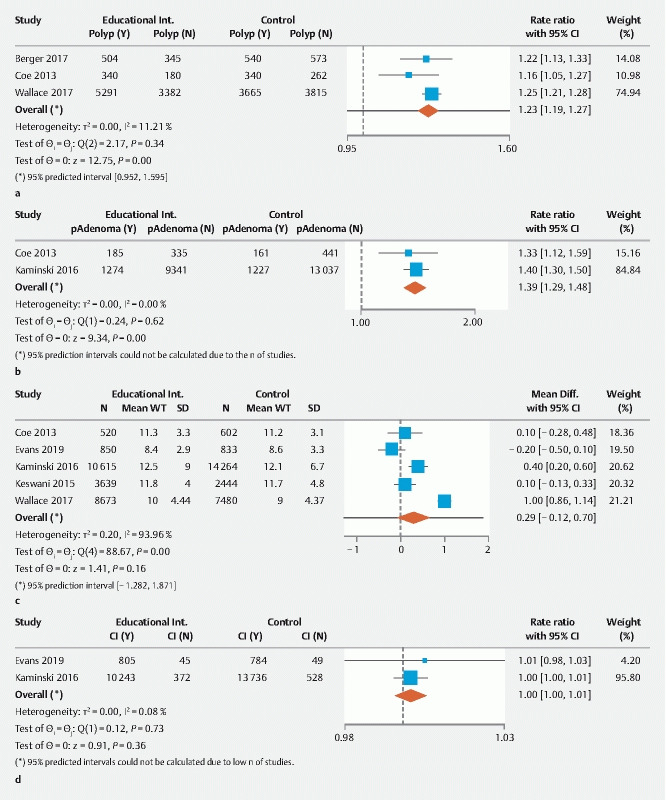
Fig. 2.

Forest plot comparing a polyp detection rate (PDR), b proximal adenoma detection rate (pADR), c withdrawal time (WT), and d cecal intubation rate (CIR) pre-educational intervention and post-educational intervention. CI, confidence interval.

Forest plot comparing a polyp detection rate (PDR), b proximal adenoma detection rate (pADR), c withdrawal time (WT), and d cecal intubation rate (CIR) pre-educational intervention and post-educational intervention. CI, confidence interval.