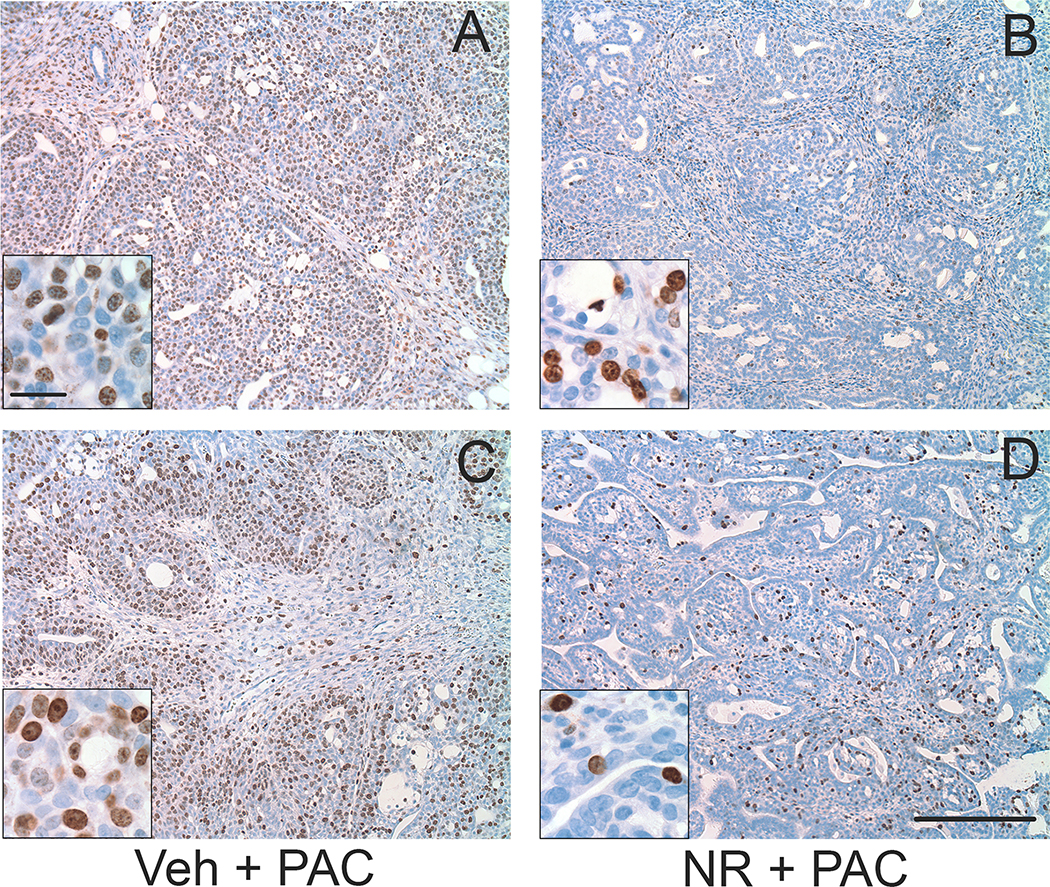
Figure 6.
Representative low-power images of the density of Ki67-positive cells in sections from (A,B) cribiform tumors and (C,D) tubulopapillary tumors. A,C: paclitaxel-treated rats that received vehicle. B,D: paclitaxel-treated rats that received NR. Insets in each panel are higher magnification. Sections were processed for Ki67 immunoreactivity (brown) and counterstained with hematoxylin (blue). Scale bar is 250 microns in low and 25 microns in high magnification images.

