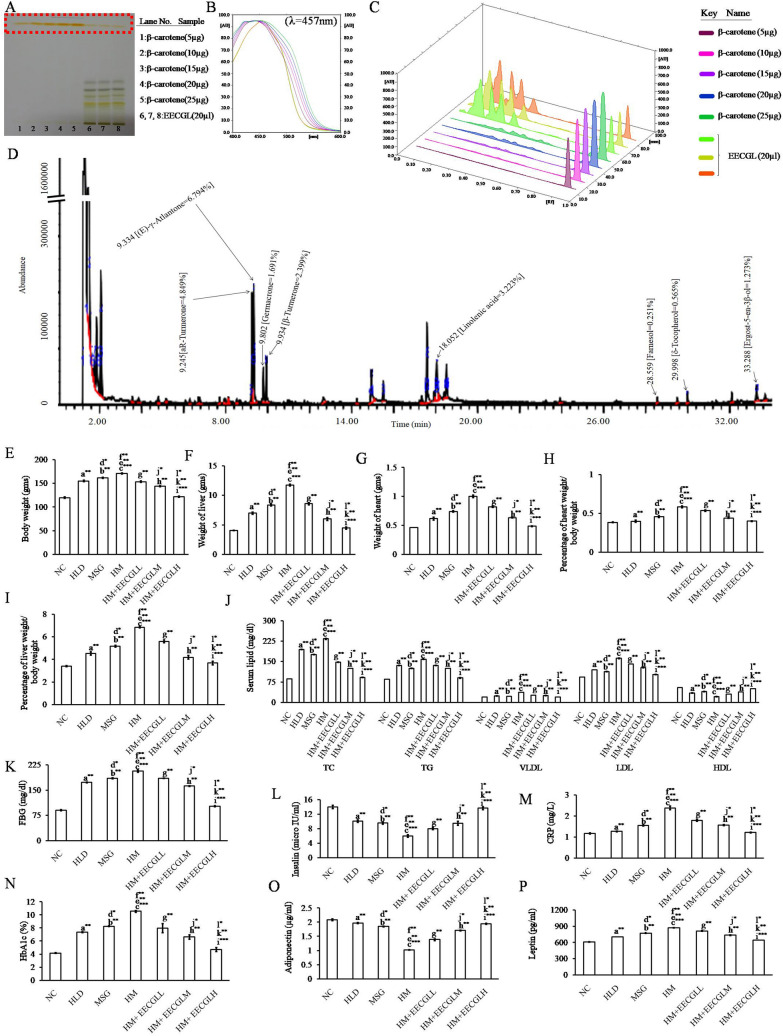
Figure 2.
Chromatographic identification of compound(s) present in the EECGL and effect of EECGL on HM induced altered body weight, organ weight, serum lipid, glucose levels and insulin resistance in rats. (A) HPTLC fingerprint showed prominent band of β-carotene (from lane 6–8 marked by red colour) of EECGL with standard β-carotene (from lane 1–5, marked by red colour with increasing concentration of the standard). (B) Overlay spectra of the EECGL with five increasing concentration of β-carotene as a standard. (C) Densitogram represented five increasing concentration of β-carotene as a standard (β-carotene peak marked by plum, lilac, purple, dark blue, forest green colour) with that of the extracts obtained from EECGL (β-carotene peak marked by lime, olive, orange colour). (D) GCMS analysis and components present in the EECGL with their retention time (left side of respective compound) and total percentage (right side respective compound). Rats were feed with HLD, MSG, HM and HM + three increasing concentration of EECGL for 28 days with regular observation of body weight and after 28 days (E) average body weight, (F) liver weight, (G) heart weight were measured and (H) percentage of heart weight/body weight, (I) percentage of liver weight/body weight were calculated. The Bar diagram represented the (J) serum lipid levels, (K) FBG, (L) insulin, (M) CRP, (N) HbA1c, (O) adiponectin and (P) leptin of the control, treatment variables and the supplements. Statistical comparison by Kruskal–Wallis nonparametric ANOVA test [P < 0.05]. Significance level based on Mann–Whitney U multiple comparison test: a-NC vs. HLD, b-NC vs. MSG, c-NC vs. HM, d-HLD vs. MSG, e-HLD vs. HM, f-MSG vs. HM, g-HM vs. HM + EECGLL, h-HM vs. HM + EECGLM, i-HM vs. HM + EECGLH, j-HM + EECGLL vs. HM + EECGLM, k-HM + EECGLL vs. HM + EECGLH, l-HM + EECGLM vs. HM + EECGLH [*P < 0.05, **P < 0.01, ***P < 0.001].

