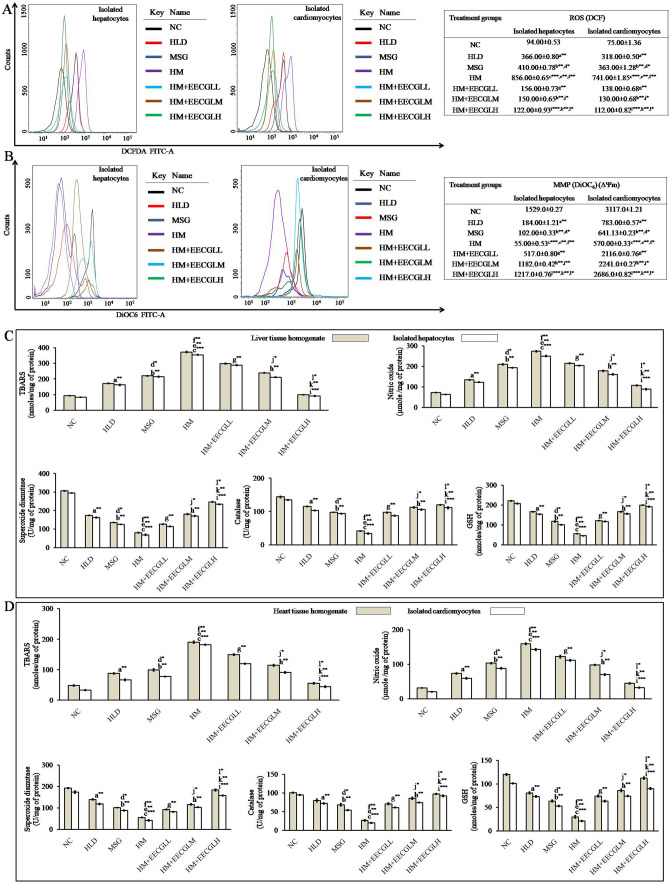
Figure 4.
Effects of EECGL on hepatic and cardiac oxidative stress and mitochondrial membrane potential. (A) Overlaid histogram plot of ROS generation in control, HLD, MSG, HM and HM + EECGL treated group. The movement of histogram towards right indicated the higher ROS generation. DCF intensity was taken along the X axis and cell count was taken along the Y-axis. Different colours of histogram represented the ROS generation in different experimental groups. On the right side of the overlay the table represented the data mean fluorescence intensity of DCF. (B) Overlaid histogram plot of MMP in control, HLD, MSG, HM and HM + EECGL treated group. The movement of histogram towards left indicated the loss MMP. DiOC6 intensity was taken along the X axis and cell count was taken along the Y-axis. Different colours of histogram represented the MMP in different experimental groups. On the right side of the overlay the table represented the data mean fluorescence intensity of DiOC6. (C) Bar diagram represented the TBARS, NO, SOD, CAT, GSH level in control, HLD, MSG, HM and HM + EECGL treated groups from liver tissue homogenate and isolated hepatocytes, respectively. (D) Bar diagram represented the TBARS, NO, SOD, CAT, GSH level in control, HLD, MSG, HM and HM + EECGL treated groups from heart tissue homogenate and isolated cardiomyocytes, respectively. Significance level based on Mann–Whitney U multiple comparison test: a-NC vs. HLD, b-NC vs. MSG, c-NC vs. HM, d-HLD vs. MSG, e-HLD vs. HM, f-MSG vs. HM, g-HM vs. HM + EECGLL, h-HM vs. HM + EECGLM, i-HM vs. HM + EECGLH, j-HM + EECGLL vs. HM + EECGLM, k-HM + EECGLL vs. HM + EECGLH, l-HM + EECGLM vs. HM + EECGLH [*P < 0.05, **P < 0.01, ***P < 0.001].

