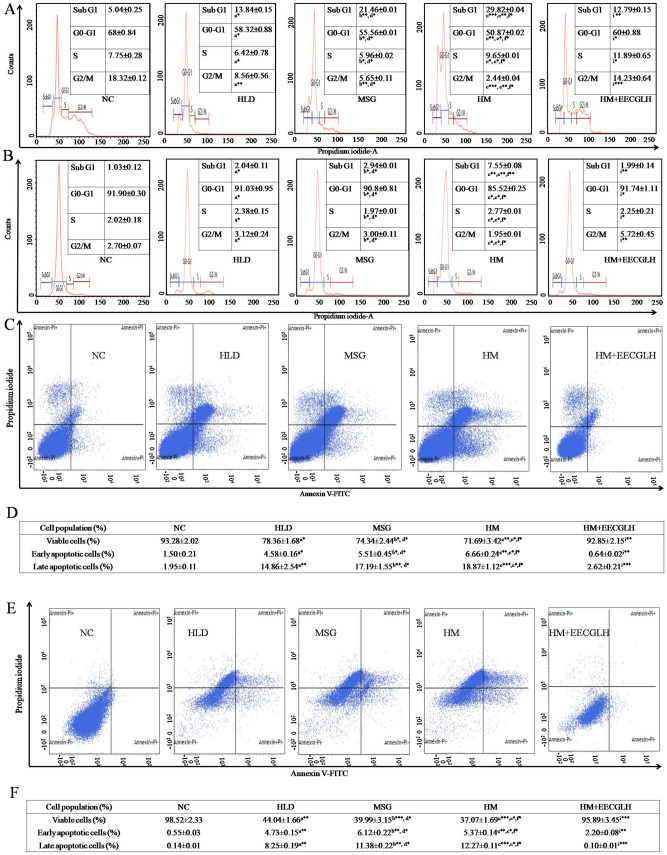
Figure 5.
Determination of cell cycle progression by RNase PI and apoptosis by Annexin-FITC and PI. On the basis of size (FSC-H) and granularity (SSC-H) selected singlet population of (A) hepatocytes and (B) cardiomyocytes population was plotted. Graphs represented the distribution of cells in different phases of cell cycle. The first peak in all graphs represented the subG1 population, second peak represented the G0–G1 and third peak represented the G2/M population. The valley between these G0–G1 and G2/M peaks represented the S phase population. Percentage (%) of cells in different phases of cell cycle was represented in the respective figures. After completion of the experiment (C) hepatocytes and (E) cardiomyocytes from NC, HLD, MSG, HM and HM + EECGLH groups were stained by Annexin-FITC and PI. The Q1 quadrant represented the viable cell populations which was the maximum in NC group. Q2 quadrant represented the early apoptotic cell populations with FITC stain. The Q3 quadrant represented the late apoptotic cell population (dual stain positive cells). Intensity of FITC in FL1-H (FITC) channel was taken along the X-axis and FL2-H channel (PI) was taken along the Y-axis. Table represented the viable, early apoptotic and late apoptotic cell populations in control, HLD, MSG, HM and HM + EECGLH treated groups of the (D) hepatocytes and (F) cardiomyocytes. Significance level based on Mann–Whitney U multiple comparison test: a-NC vs. HLD, b-NC vs. MSG, c-NC vs. HM, d-HLD vs. MSG, e-HLD vs. HM, f-MSG vs. HM, i-HM vs. HM + EECGLH [*P < 0.05, **P < 0.01, ***P < 0.001].

