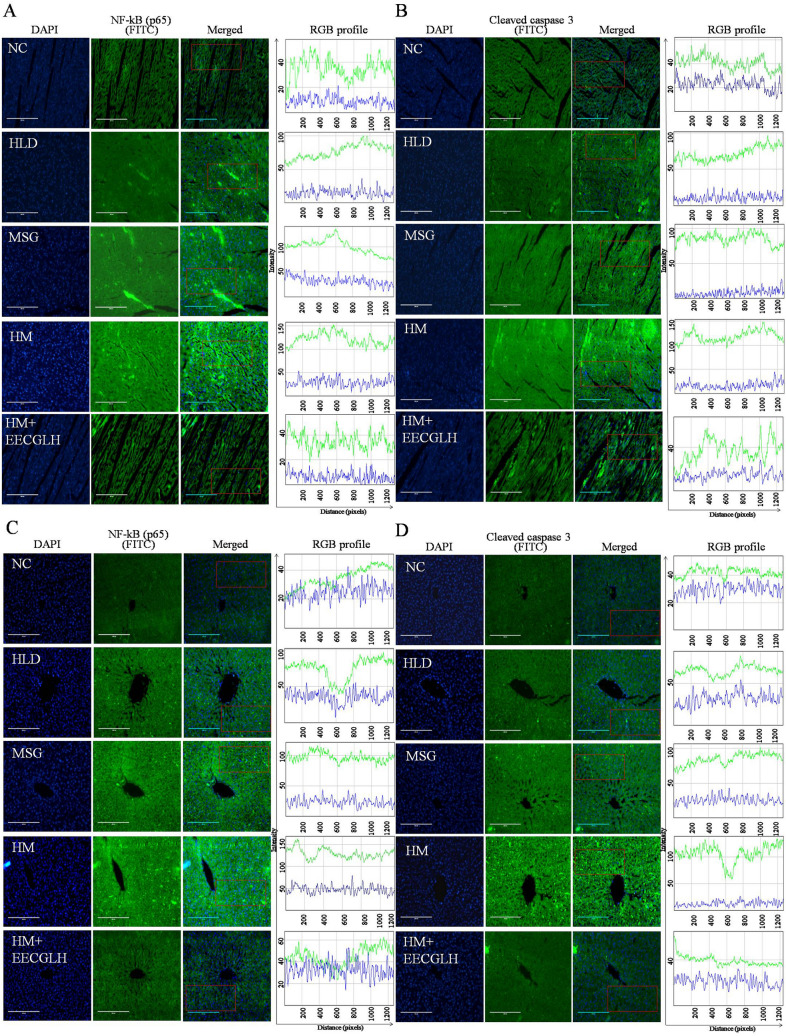
Figure 6.
Nuclear translocation of nuclear factor kappa B (p65) and cleaved caspase 3 by immunohistochemistry of control, HLD, MSG, HM and HM + EECGLH treated groups of liver and heart tissue. Nuclear translocation of NF-kB (p65) of (A) heart tissue section and (C) liver tissue section were represented. Nuclear translocation of cleaved caspase 3 of (B) heart tissue section and (D) liver tissue section were represented. The nuclei were stained by DAPI which appeared blue and NF-kB (p65) or cleaved caspase 3 was stained by FITC tagged secondary antibody which appeared green. The merged images showed the infiltration of green colour into the blue region which indicated the nuclear translocation of NF-kB (p65) or cleaved caspase 3. NF-kB (p65) and cleaved caspase 3 positive nuclei were estimated from the selected region marked by red colour. The intensity of DAPI and FITC was plotted using ImageJ software (NIH Image J system, Bethesda, MD) for quantification of fluorescence intensity. The intensity (in arbitrary unit) was taken along the Y-axis and distance (in pixel) was plotted along the X-axis. For control, HLD, MSG, HM and HM + EECGLH groups the green line indicated the intensity of FITC and blue line indicated the intensity of DAPI.

