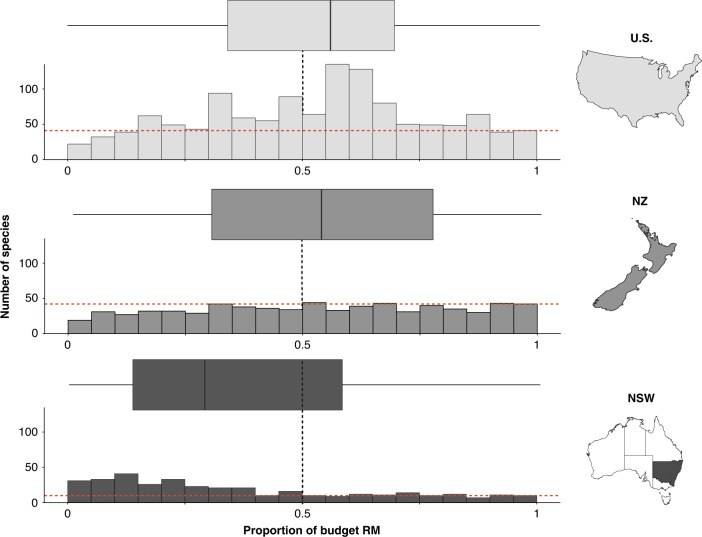
Fig. 1. Proportion of the budget allocated to research and monitoring for threatened species (n = 2261 species in three jurisdictions: United States (U.S.), New Zealand (NZ), and New South Wales (NSW)).
The stippled red line indicates the number of species with >95% of the budget allocated to research and monitoring (RM). The box and whiskers show the proportion of recovery plan budgets allocated to research and monitoring in each jurisdiction, with the median as a line, first and third quartiles as hinges, and the highest and lowest values within 1.5 times the inter-quartile range as whiskers. The black stippled line indicates the mean among jurisdictions (50%). Maps were created in ArcGIS for Desktop (10.3, ESRI Inc., USA).

