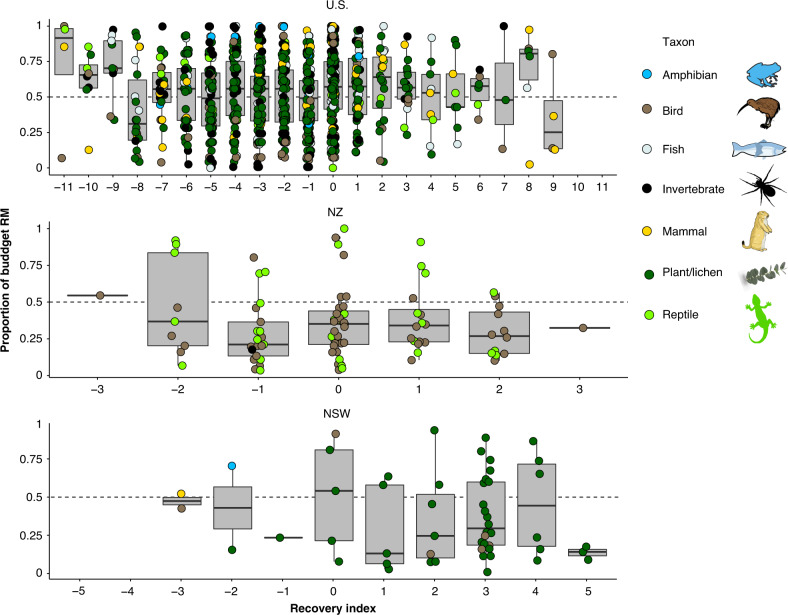
Fig. 3. Species with poor recovery outcomes have a higher proportion of the budget allocated to research and monitoring.
The median and range of proportion of recovery plan budgets allocated to research and monitoring (RM) for n = 1143 threatened species in the United States (U.S.), New Zealand (NZ), and New South Wales, Australia (NSW) as a function of index of recovery. The index of recovery is the sum of reports in which population increases (+1), decreases (−1), or remains constant (0) between assessments, the range for the U.S. is: −11 to 11, NZ: −3 to 3, and NSW: −5 to 5 (although no species had an index of −5 or −4). Taxon of each species is indicated by color. For each recovery index, the box and whiskers show the median as a line, first and third quartiles as hinges, and the highest and lowest values within 1.5 times the inter-quartile range as whiskers. All vector graphics are open source.

