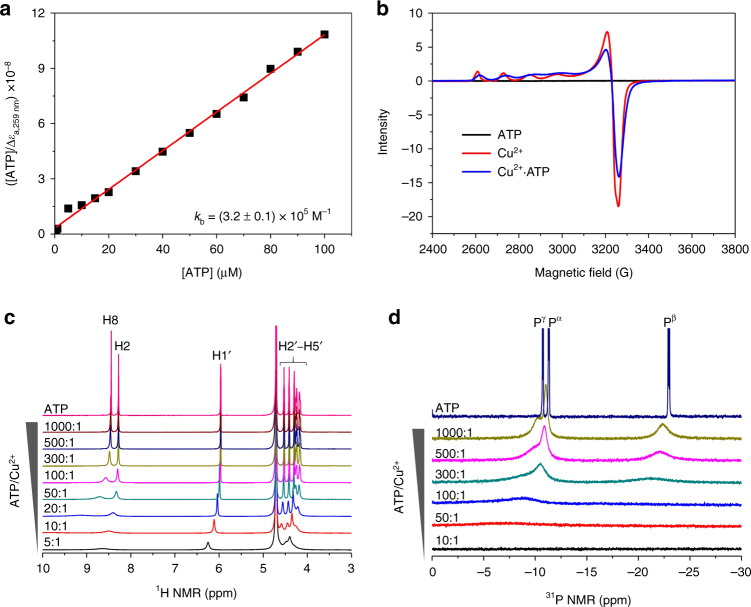
Fig. 3. The interaction between ATP and Cu2+ ions.
a The apparent binding constant (kb) of ATP and Cu2+ ions derived from the plot of [ATP]/Δεa,259 nm vs. [ATP] at various concentrations (5–100 μM) for Cu(OTf)2 (5 μM). b EPR spectra of ATP, Cu2+ and Cu2+·ATP. Experimental conditions: ATP (50 mM), Cu(OTf)2 (10 mM), glycerol (20 v/v%), MES (20 mM, pH 5.5), 100 K. c 1H NMR and d 31P NMR spectroscopic titrations of ATP (120 mM) by varying the concentration of CuCl2 (0.12–24 mM) in D2O.

