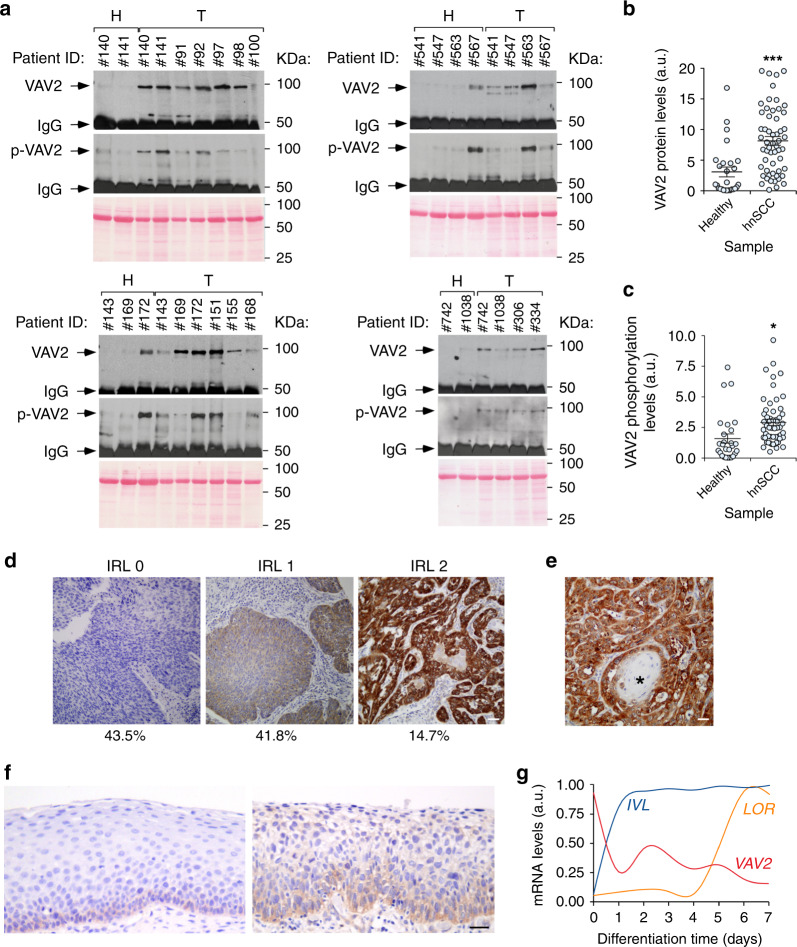
Fig. 2. VAV2 protein is overexpressed in hnSCC.
a Levels of total (VAV2) and tyrosine-phosphorylated (p-VAV2) VAV2 in healthy (H) and tumor (T) tissues from hnSCC patients (n = 83). The band corresponding to the antibody used for the immunoprecipitation step is indicated (IgG). Amount of total protein content in the extracts used for the immunoprecipitation was tested in parallel filters using Ponceau staining (bottom panels). KDa, kilodalton. b VAV2 abundance according to data from a. ***P < 0.0001 (two-tailed Mann–Whitney test, n = 83 patient samples). a.u., arbitrary units. c VAV2 tyrosine phosphorylation levels according to data obtained in a. *P = 0.011 (two-tailed Mann–Whitney test, n = 83 patient samples). Please, note that the total levels of tyrosine phosphorylation of VAV2 in these analyses are probably underestimated given the long experimental procedure associated with tumor collection and subsequent lysis. d Example of tumor sections showing the indicated VAV2 immunoreactivity levels (IRL, top). The percentages of tumor samples (% out of a total of 232 tumors analyzed) showing the indicated VAV2 immunoreactivity levels are shown at the bottom. n = 232 tumor samples. Scale bar, 200 μm. e Representative image showing the lack of VAV2 immunoreactivity in terminally differentiated areas (asterisk) of VAV2-positive tumors. Scale bar, 100 μm. f Representative images of the immunohistochemical staining of VAV2 in healthy (left) and dysplastic (right) samples from human oral epithelium. Sections were counterstained with hematoxylin. n = 232 tumor samples. Scale bar, 100 μm. g Expression levels of the indicated transcripts according to the differentiation status of keratinocytes. Data were obtained from the GEO GSE52651 dataset (see “Methods”). IVL involucrin (an mRNA expressed from the early stages of keratinocyte terminal differentiation); LOR loricrin (a transcript encoding a major protein component of the cornified cell envelope that is found in terminally differentiated epidermal cells). In b and c, data represent the mean ± SEM. Source data for this figure are provided as a Source Data file.

