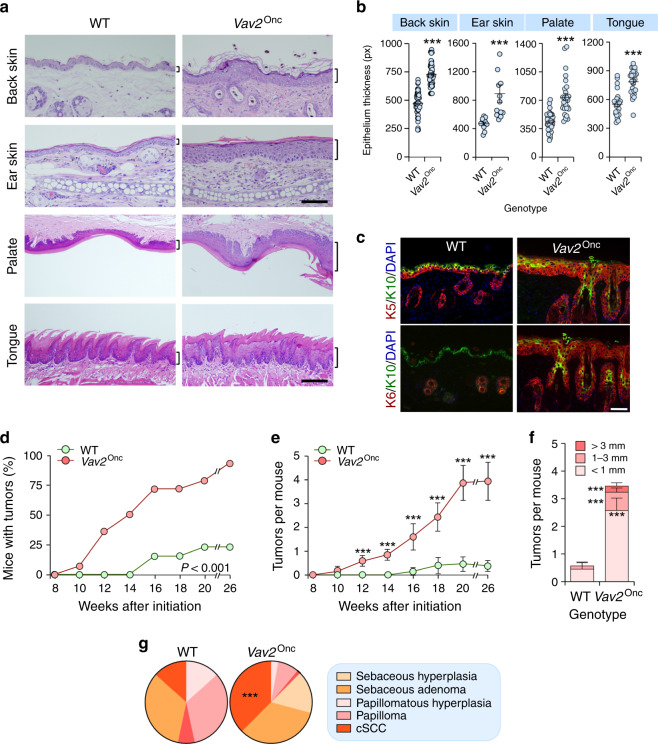
Fig. 3. Upregulated VAV2 signaling creates a protumorigenic niche.
a Histological sections of the epithelia from mice of the indicated genotypes. The thickness of the epithelium is indicated with a bracket. Scale bar, 100 (back and ear skin) and 200 (palate and tongue) μm (n = 6 animals per genotype). b Thickness of indicated epithelial linings according to the data gathered in a. ***P < 0.0001 (two-tailed Student’s t-test, n = 6 animals per genotype). px pixel. c Expression of keratin 5 (K5; top, red color), keratin 6 (K6; bottom, red color), and keratin 10 (K10; both panels, green color) in the skin from the back of animals of indicated genotypes. In all cases, the nuclei of cells were labeled with DAPI (blue color). Scale bar, 50 μm (n = 3). Penetrance (d) and multiplicity (e) of tumors generated in mice of the indicated genotypes upon a single topic DMBA application at postnatal day 3. The differences between genotypes were statistically significant from week 12 onwards (P < 0.0001, two-tailed Student’s t-test). n = 24 and 31 WT and Vav2Onc/Onc mice, respectively. f Size distribution of the tumors at the endpoint of the experiment shown in d. ***P < 0.0001 (two-tailed Student’s t-test, n as in d). g Tumor type distribution at the endpoint of the experiment shown in d. P < 0.0001 (Chi-squared test, n = 15 and 72 WT and Vav2Onc/Onc tumors, respectively). In b, e, and f, data represent the mean ± SEM. Source data for this figure are provided as a Source Data file.

