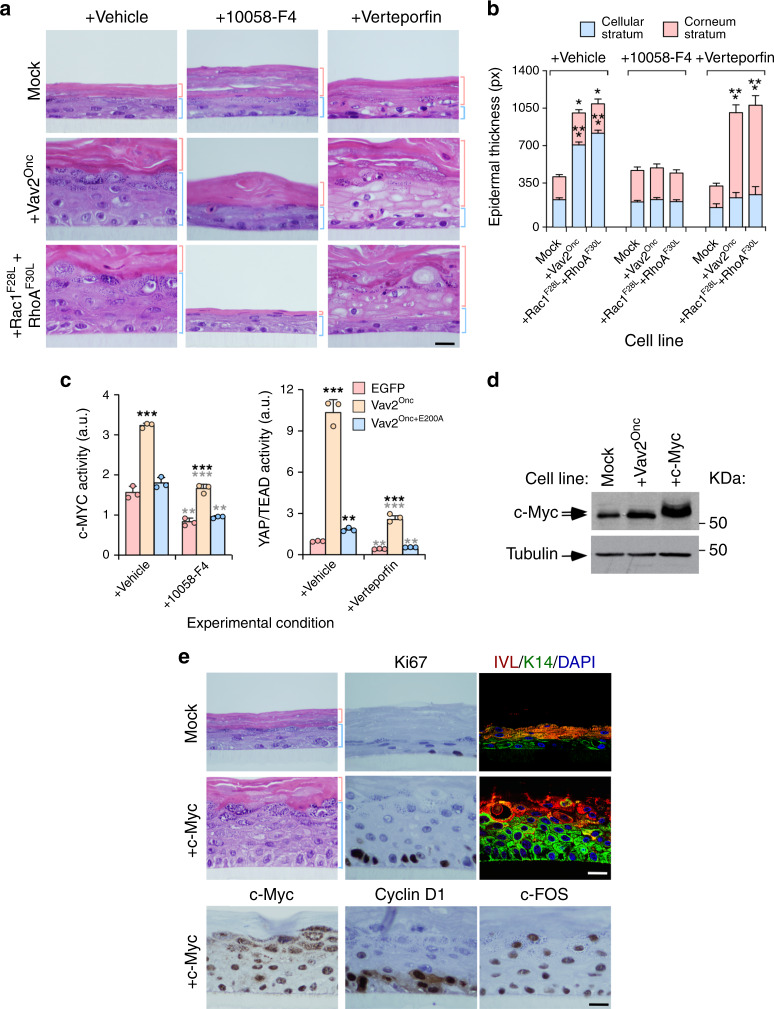
Fig. 7. Vav2Onc-driven hyperplasia is c-MYC- and YAP-dependent.
a Histological sections of 3D organotypic cultures of human keratinocytes expressing the indicated proteins (left) that have been treated with the inhibitors shown on top. Scale bar, 10 μm (n = 3 independent cultures). b Thickness of the cellular and corneum strata using data from a. *P = 0.012 (Vav2Onc vehicle, stratum corneum), 0.037 (Rac1F28L + RhoAF30L vehicle, stratum corneum); ***P < 0.0001 (all other tests) (ANOVA and Dunnett’s multiple comparison test, n = 3 independent cultures). c Demonstration that the transcriptional activity of c-MYC and TEAD is inhibited by MYC (10058-F4) and YAP/TEAD interaction (Verteporfin) inhibitors, respectively. Black and gray stars indicate the P value of the indicated experimental values when compared to EGFP-transfected and vehicle-treated cells, respectively. **P = 0.003 (EGFP, 100058-F4, MYC activity), 0.002 (Vav2Onc+E200A, 100058-F4, MYC activity), 0.001 (Vav2Onc+E200A, vehicle, YAP/TEAD activity), 0.001 (EGFP, Verteporfin, YAP/TEAD activity), 0.002 (Vav2Onc+E200A, Verteporfin, YAP/TEAD activity); ***, P < 0.0001 (all other tests) (ANOVA and Tukey’s HSD test, n = 3 independent experiments). d Expression of endogenous and ectopic c-Myc in indicated cell lines. Tubulin was used as loading control (bottom). n = 3 independent experiments. e Staining of indicated human keratinocytes (left) with hematoxylin-eosin (left and middle two rows of panels) and antibodies to Ki67 (two top middle panels), IVL (two right panels on top, red color), K14 (two right panels on top, green color), ectopically expressed c-Myc (left bottom panel), endogenous Cyclin D1 (middle bottom panel) and endogenous c-FOS (right bottom panel). When indicated, some sections were counterstained with DAPI (two right panels on top. blue color). Scale bar, 10 μm (n = 3 independent cultures). In b and c, data represent the mean ± SEM. Source data for this figure are provided as a Source Data file.

