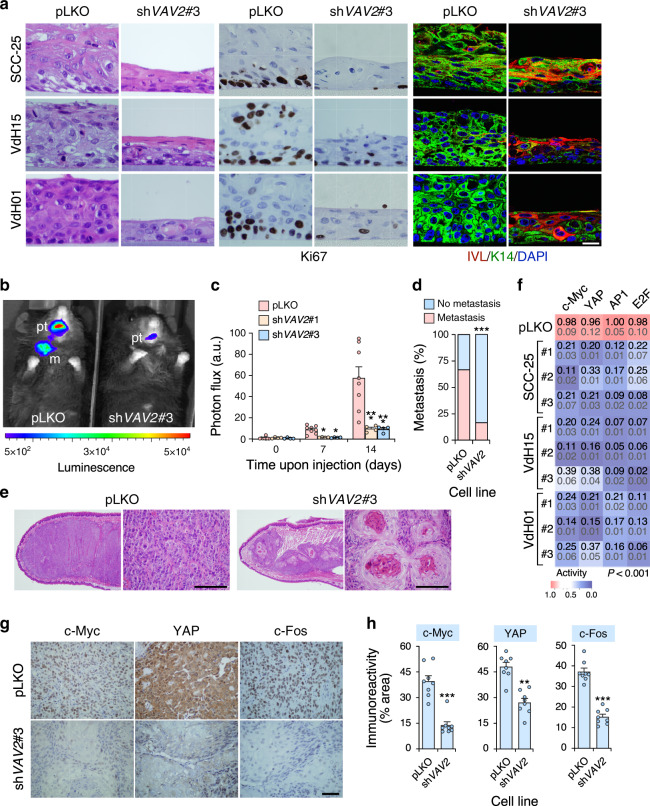
Fig. 9. Endogenous VAV2 is required for the fitness of hnSCC cells.
a Images of sections from organotypic cultures of the indicated control (pLKO) and VAV2 knockdown (shVAV2) cell lines upon staining with hematoxylin-eosin (two left columns of panels) and antibodies to Ki67 (two middle columns of panels), IVL and K14 (two right columns of panels). Some of the sections were counterstained with either hematoxylin (two middle columns of panels) or DAPI (two right columns of panels, blue color). The specific cell line and experimental modification used is shown on the left and top, respectively. pLKO, cells transduced with an empty lentivirus. shVAV2#3, cells transduced with a lentivirus encoding the VAV2 shRNA #3. The same notation will be used in the rest of panels of this figure. Scale bar, 10 μm (n = 5 independent cultures). b Luminescence readings at the endpoint of the tongue orthotopic xenograft experiment using the indicated VdH15 cells (n = 8 per cell type derivative). pt, primary tumor; m, metastasis. c Photon flux of the indicated xenografted animals according to data from panel b. Data represent the mean ± SEM. *P = 0.010 and 0.012, respectively (day 7); ***P < 0.0001 (day 14) (Kruskal–Wallis test, n = 8). d Lymph node metastatic events detected in animals used in panel b. Data represent percentage. ***P < 0.0001 (Chi-squared test, n = 8). e Histological sections of the SCC tumors formed by the indicated VdH15 cells in the experiments shown in b. Scale bar, 75 μm (n = 8 per cell type derivative). f Luciferase activity recorded in the indicated cells (left) upon transient transfection with plasmids encoding the luciferase gene under the regulation of promoters regulated by the indicated transcriptional factors (top). For each condition, the mean and the SEM are indicated in black and gray, respectively. The color gradient is proportional to the level of inhibition achieved when compared to control cells (whose values are shown in red). #1, #2 and #3 (left) refer to the independent shRNAs used to knockdown endogenous VAV2. For all of them, P < 0.001 (ANOVA and Dunnett’s multiple comparison test, n = 3 independent experiments). g Expression of indicated proteins (top) in tumors formed in the experiment shown in b. Scale bar, 50 μm (n = 8). h Quantification of immunohistochemical data from g. **P = 0.001; ***P < 0.0001 (two-tailed Student’s t-test, n = 8). Data represent the mean ± SEM. Source data for this figure are provided as a Source Data file.

