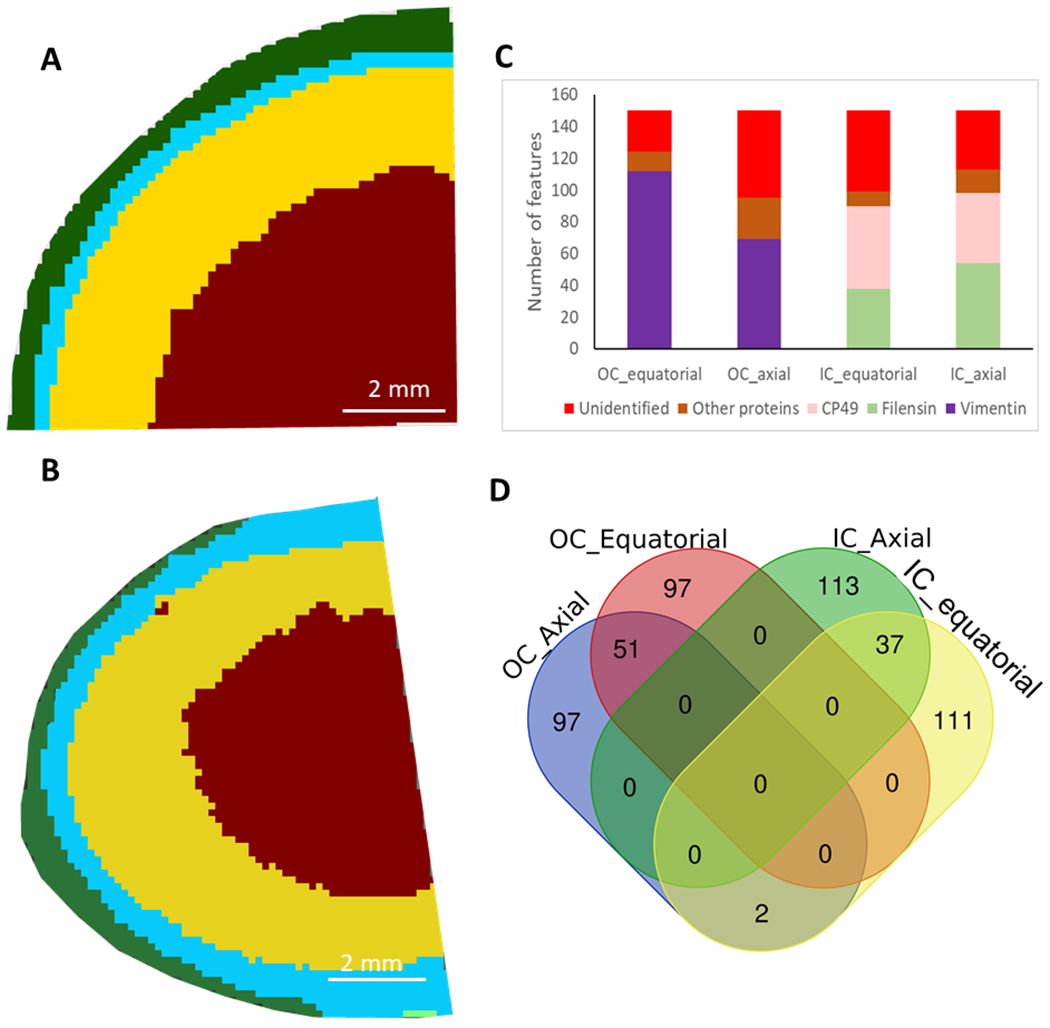
Figure 4.

Spatial segmentation of lens IMS data determined using SCiLS software. Segmentation of the equatorial section image data is shown in A and segmentation for the axial section image data is shown in B. The two regions segmented in the cortex region were defined as outer cortex (OC) and inner cortex (IC) regions. Identification of the signals colocalized with each region is shown in C and vimentin was enriched in the outer cortex region and lens beaded filament proteins were enriched in the inner cortex region. D: Venn diagram shows signals enriched in OC and IC had virtually no overlap.
