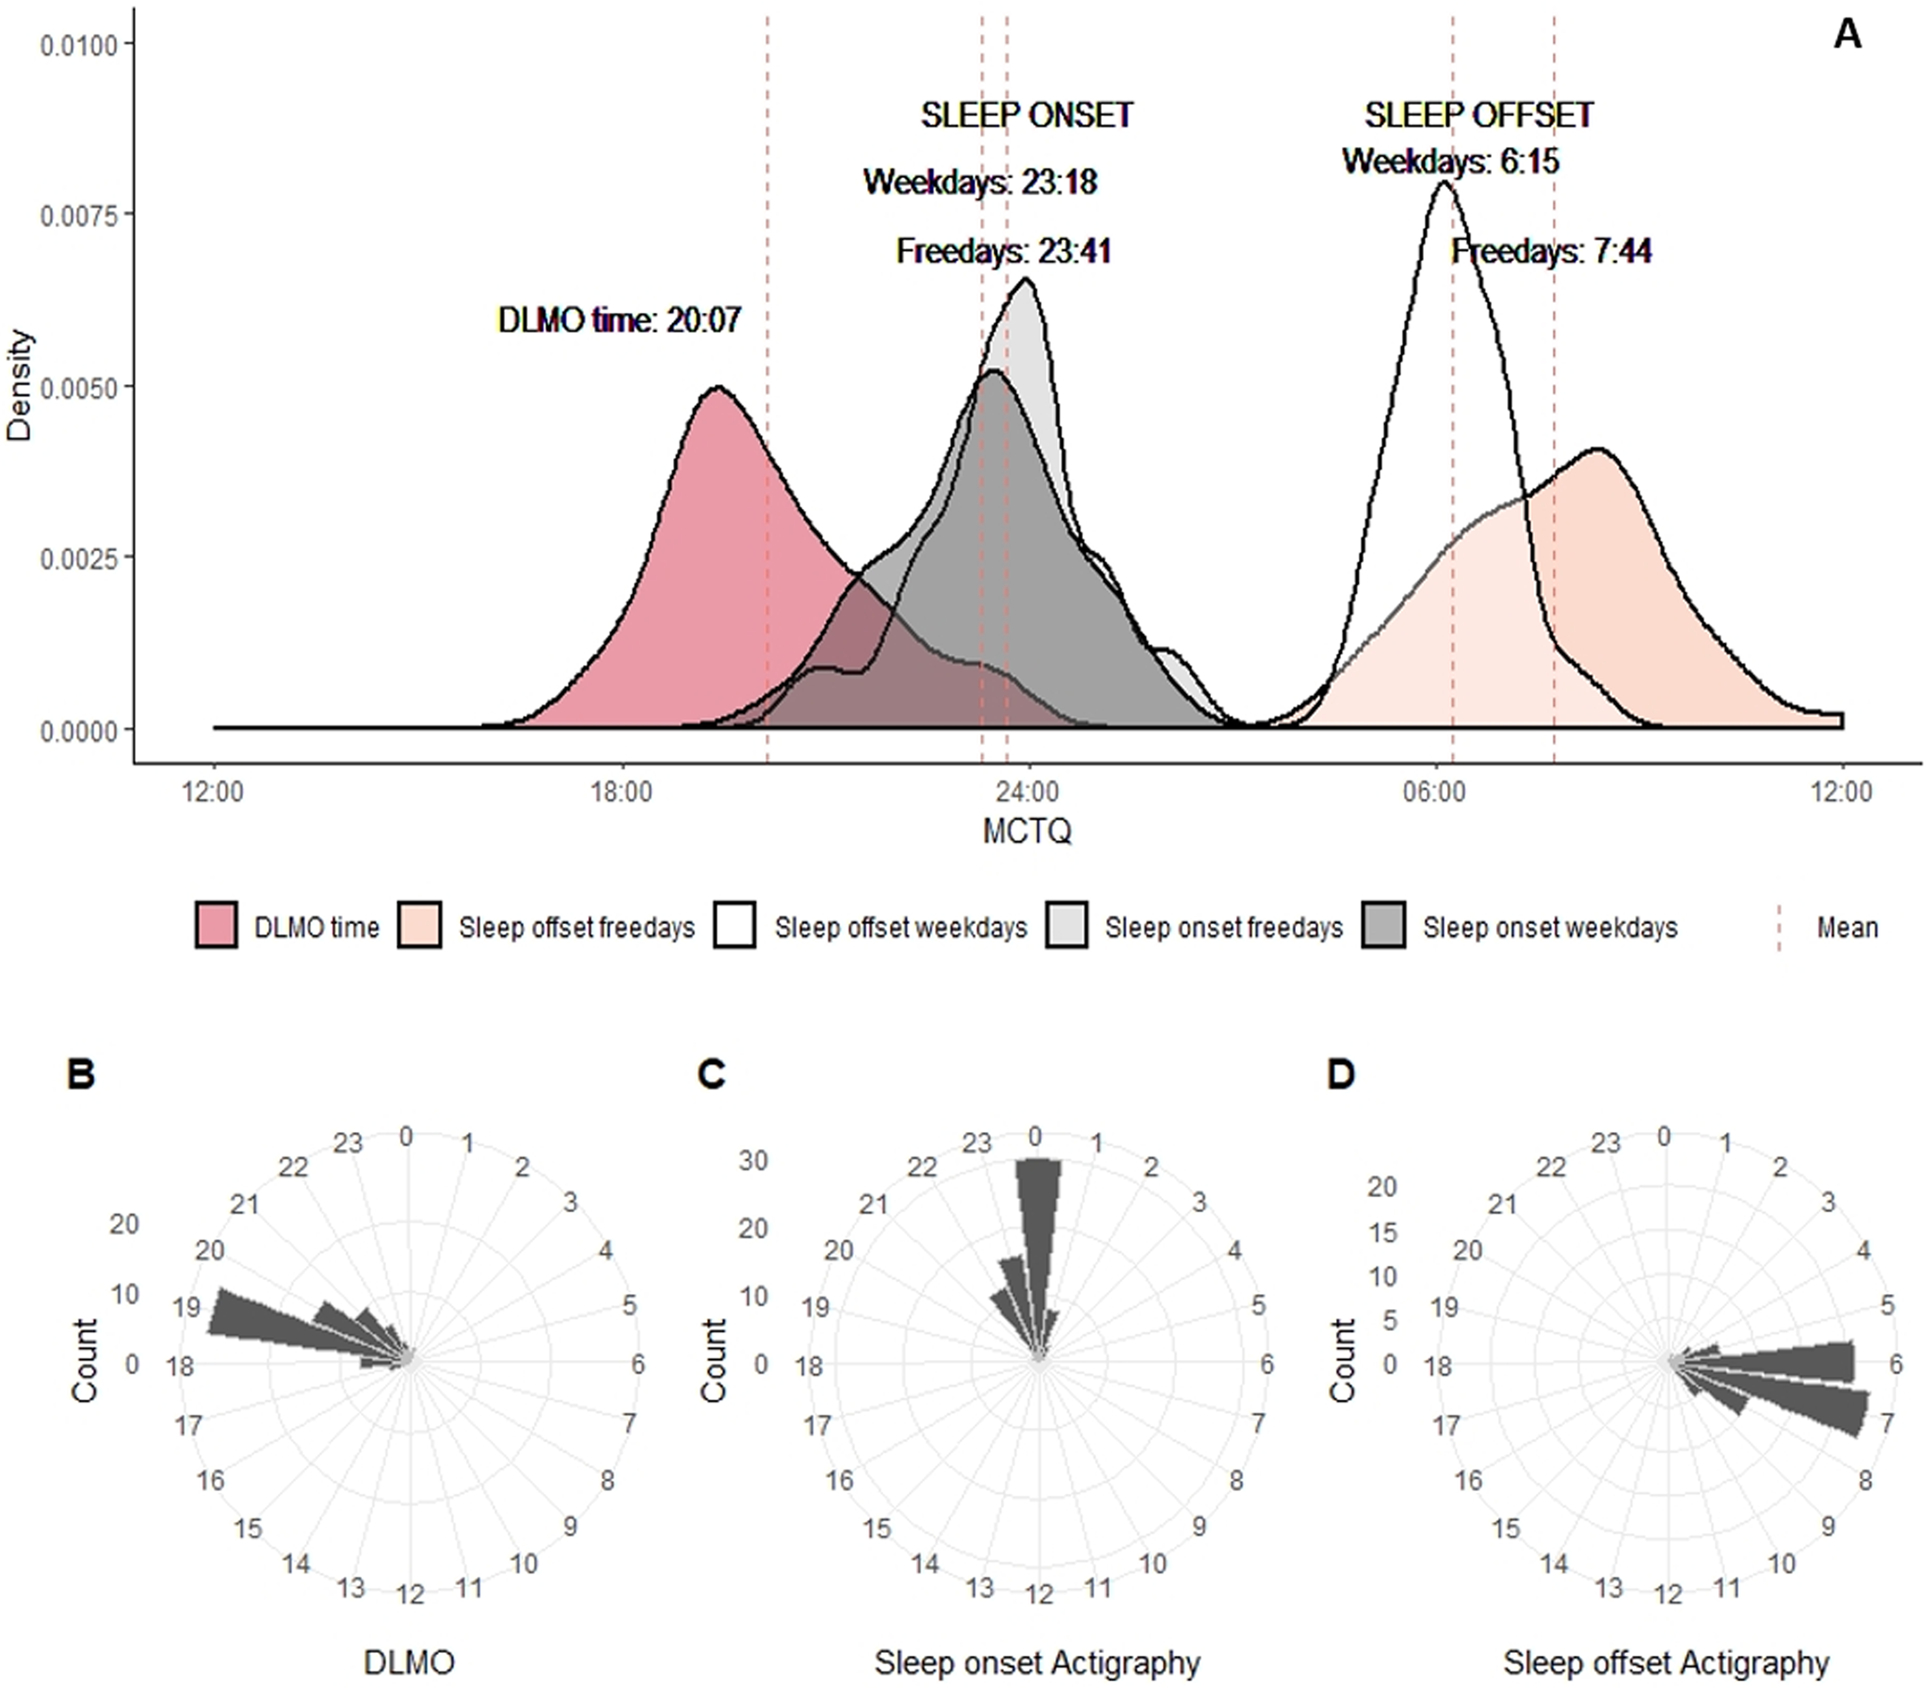
Figure 2:

Relationship between DLMO time and sleep schedules obtained from MCTQ and actigraphy. (A) Density plots representing DLMO time compared with reported sleep habits at work days and work-free days from MCTQ; (B) Daily hour circular plots representing DLMO time, (C) sleep onset from actigraphy, (D) sleep offset from actigraphy. Bar heights are proportional to the number of individuals with DLMO, sleep onset and offset time from actigraphy within each hour.
