
Figure 4:
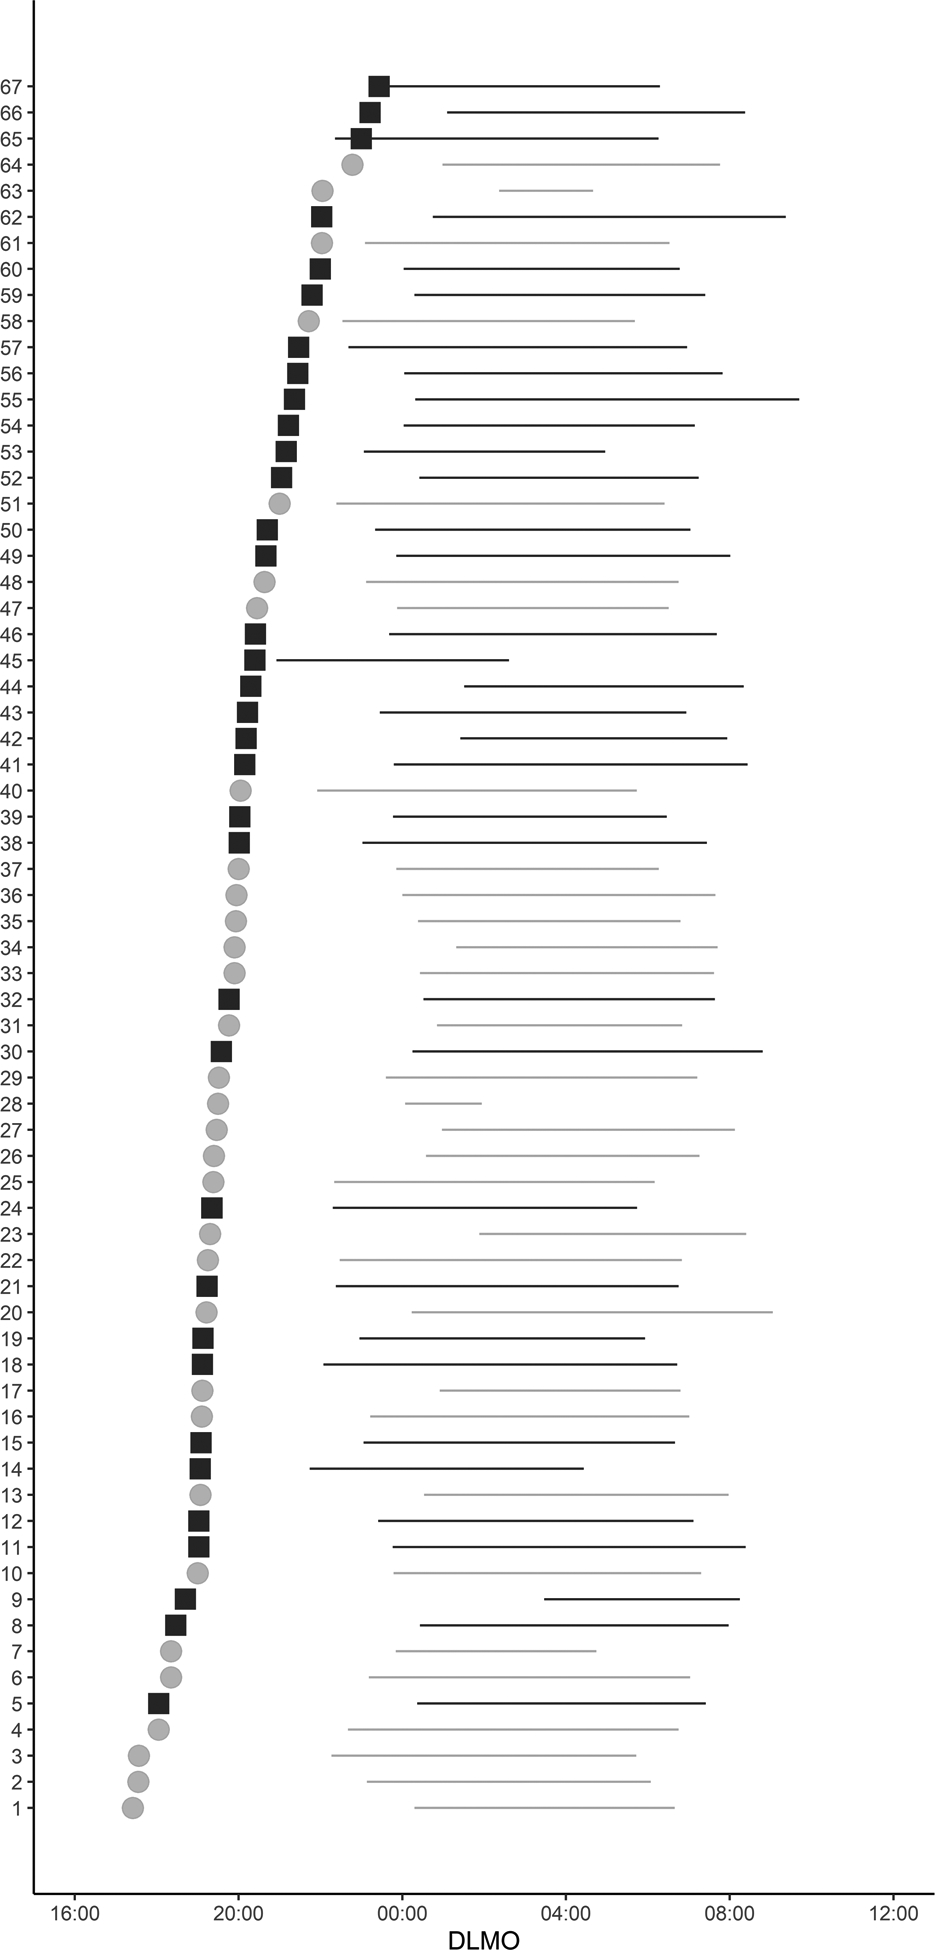
Individual differences in DLMO and its relationship to habitual nighttime sleep. DLMO time is represented by filled squares for women (black) and filled circles for men (grey). To represent the habitual sleep schedule the average of sleep episodes obtained using actigraphy plotted using horizontal bars. Bar heights are proportional to the number of individuals with DLMO, sleep onset and offset time from actigraphy within each hour. Data are ordered from earliest to latest DLMO. Four participants were excluded from the figure due to missing actigraphy data.