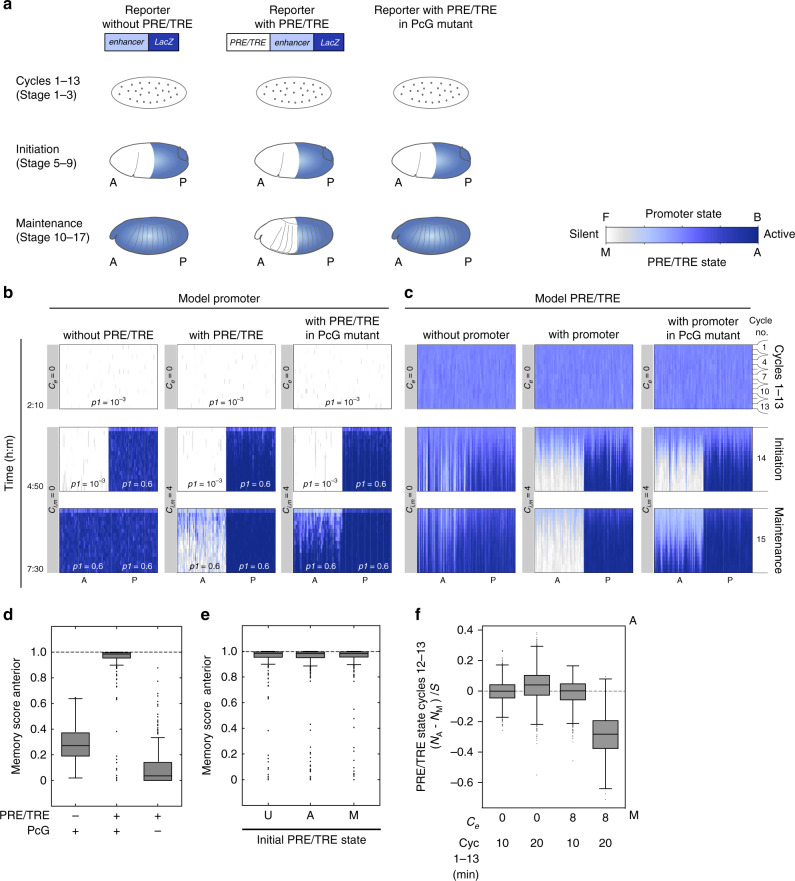
Fig. 2. The model recapitulates memory of silencing.
a Experimental test of epigenetic memory of silencing2,3. See main text for details. Top: transgenic LacZ reporter constructs. Bottom: embryonic LacZ patterns. Active LacZ: blue. Anterior: A, posterior: P. b, c Simulated time courses of Drosophila development showing promoter state (b) and PRE/TRE state (c) over time. Active: blue; silent: white. Division cycles are indicated (right). Plots show results from model 1 (see also Supplementary Figs. 1 and 2). Initial conditions, promoter: all sites are F; PRE/TRE: all nucleosomes are U. b Promoter state. The input values of p1, Ce and Ci,m are shown on the plots, p2 (TF dissociation) was 0.1 in all simulations (see also Supplementary Table 2). Input values of p3 and p4 = 0.25, p5 = 0.04. Simulations were performed without coupling between promoter and PRE/TRE (left), and with coupling during the initiation and maintenance phases (middle). Right: PcG mutant was simulated by reducing p3 to 0.001 at the onset of the maintenance phase. (c) PRE/TRE state. Parameter values as in (b); (see also Supplementary Table 2 and Supplementary Fig. 2). For each condition, data from 50 independent simulations are shown. Promoter and PRE/TRE data from the same simulation run are shown. Each of the 50 simulations is continuous throughout the vertical scale. d, e Memory score in anterior compartment (1 indicates perfect memory, see Supplementary Fig. 2 for calculation). Boxplots of data for 400 independent simulations. Central mark on box plots: median; bottom and top edges of box: 25th and 75th percentiles, respectively. Whiskers extend to cover 99.3% of the data. Outliers are plotted as dots. f PRE/TRE states for the different early cycle conditions as indicated, averaged over cycles 12 and 13 for 1000 independent simulations. PRE/TRE state (on a scale of −1 to +1, where −1 is silent, and +1 is active). NA = number of A nucleosomes, NM = number of M nucleosomes, S = total number of nucleosomes. Boxplot parameters as in (d, e).

