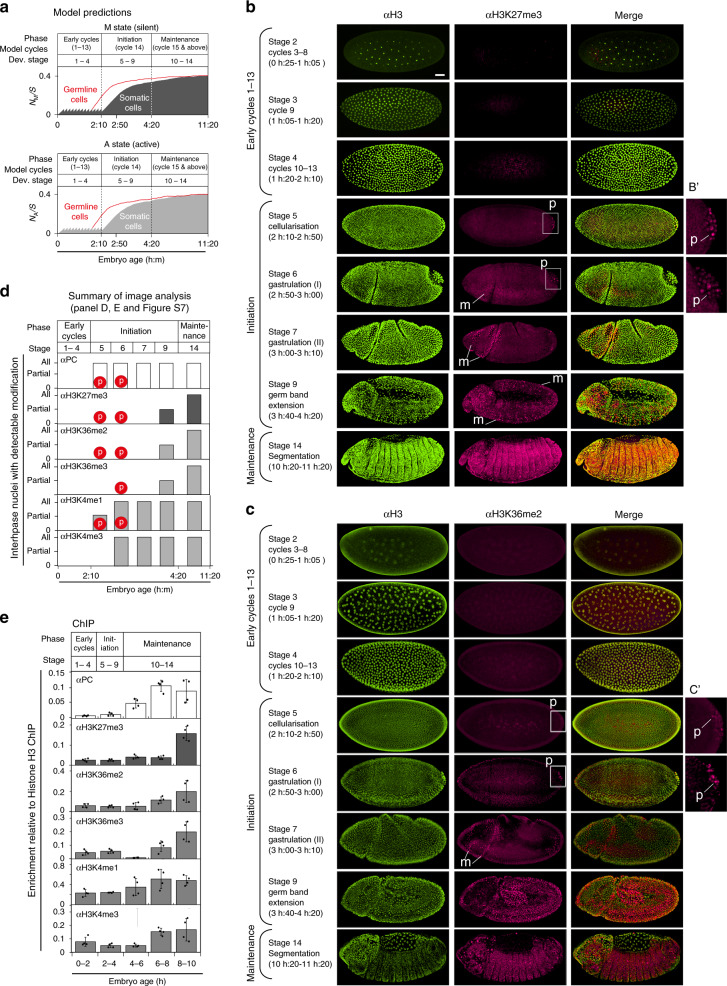
Fig. 4. Chromatin modifications increase during Drosophila development.
a Simulated time course of accumulation of M (top) and A (bottom) nucleosomes as a proportion of total nucleosomes (S) in the array over developmental time, averaged over 1000 individual simulations. Solid grey: somatic cells, red line: germline cells, modelled by implementing early cycles 1–9, followed by cycle 10 of 2 h, and subsequent G2 arrest for the rest of the simulation36. Parameters as in Fig. 2b, c (no coupling between PRE/TRE and promoter). b, c Embryos were fixed and double stained with antibodies against unmodified histone H3 (green, left panels) and H3K27me3 (b) or H3K36me2 (c) (magenta, middle panels). Merge: right panels. Embryos were staged according to morphology, as indicated. Three slides per antibody were prepared, typically containing 50–100 embryos, of which 5–10 were at the required stage and all showed similar staining for a given stage. White boxes at stages 5 and 6 indicate pole cells (p), which first become apparent at stage 5. B’ and C’ show 3× zoom of boxed area. Mitotic cells are indicated at stages 6–9 where visible (m). Scale bar represents 75 μm and is the same for all panels except B’ and C’. d Summary of immunofluorescence analysis shown in (b, c) and Supplementary Fig. 5. Red circles, p, indicate the stage at which staining of each modification was visible in pole cell nuclei. Stages at which histone modifications became visible in interphase nuclei are indicated (white or grey bars). “Partial” indicates that a proportion of nuclei showed detectable histone modifications. “All” indicates that all nuclei contained signal for the modification or protein. e ChIP analysis of PC and histone modifications in staged embryos as indicated. Global levels are shown as a proportion of histone H3 ChIP for each stage (see “Methods”). Data are presented as mean values ± SD of two IPs each made from two independent chromatin preparations (= four independent IPs in total). Individual data values are shown as black circles.

