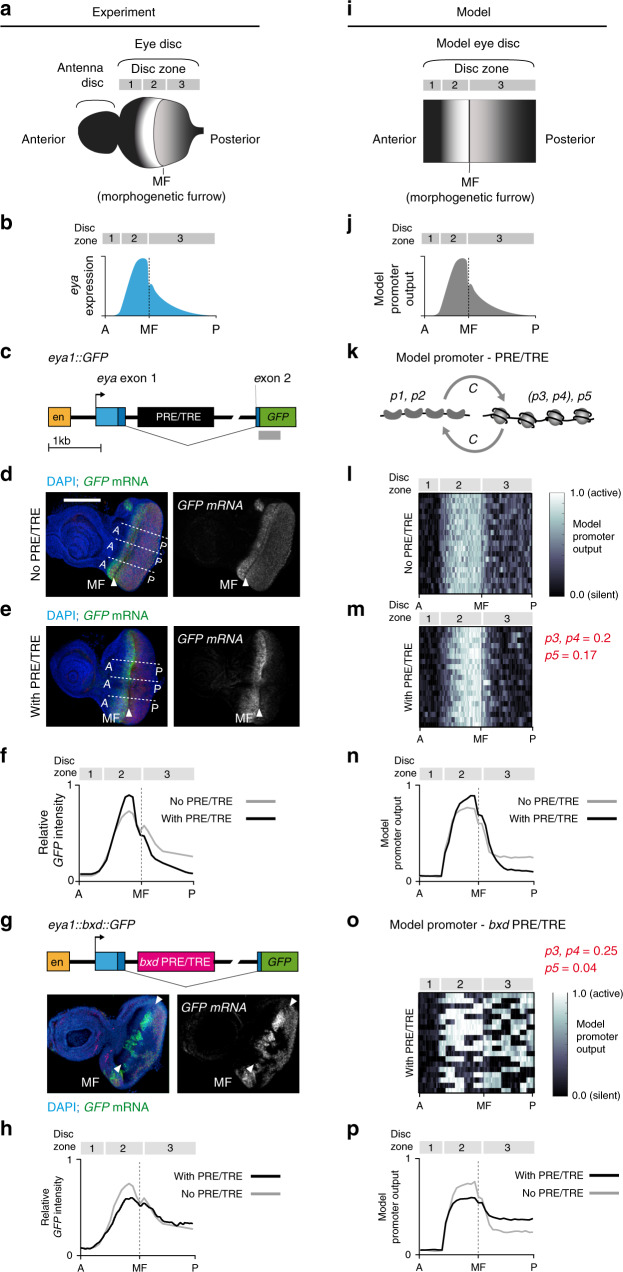
Fig. 6. Two PRE/TREs respond differently to a dynamically regulated promoter.
a Third instar larval eye-antenna disc. b eya expression levels in mid-3rd instar larval eye disc across zones 1–3 (A, anterior; P, posterior,). c eya1::GFP reporter construct. Yellow (en), eya enhancer; blue, eya exons (light blue, 5′ UTR; dark blue, coding region); black, eya PRE/TRE. Grey bar: RNA in situ probe used in (d) and (e). d, e RNA in situ hybridisation against GFP on mid 3rd instar eye-antenna disc of larvae homozygous for the eya1::GFP transgene (e), or the same transgene lacking the PRE/TRE (d). Scale bar, 100 μm, same for (g). Six to ten discs for each transgene gave similar results. f Signal intensity profiles along the A-P axis (dotted lines shown on the discs in d, e). Multiple line scans perpendicular to the morphogenetic furrow were averaged for six - 10 discs for each transgene and aligned to the morphogenetic furrow, the anterior limit of the expression domain and the posterior edge of the disc. Vertical scale represents signal intensity relative to the maximum of GFP mRNA. g Top: eya1::bxd::GFP reporter construct. 1.5 kb of the eya PRE/TRE was replaced in the reporter construct with 1.5 kb of the bxd PRE/TRE (see “Methods”). Bottom: RNA in situ hybridization against GFP mRNA shows variegation. Similar results were obtained for eight discs. h Average signal intensity profiles generated as in (f), except that the whole disc area was scanned to reduce noise due to variegation. i Model eye disc. The eye disc was modeled as described in Supplementary Methods and Supplementary Fig. 8. j The model promoter output was quantified by averaging the anterior-posterior profiles of 100 simulations. k–m Model promoter and PRE/TRE. l No PRE/TRE. m With PRE/TRE (Model 1, Ci,m = 0 (zone 1); Ceya = 2.5 (zones 2 and 3)). n Average model promoter output for 100 independent simulations. o Simulated eye disc showing best fit to eya1::bxd::GFP data shown in (h). p Average model promoter output for 100 independent simulations. See also Supplementary Figs. 1, 7 and 8.

