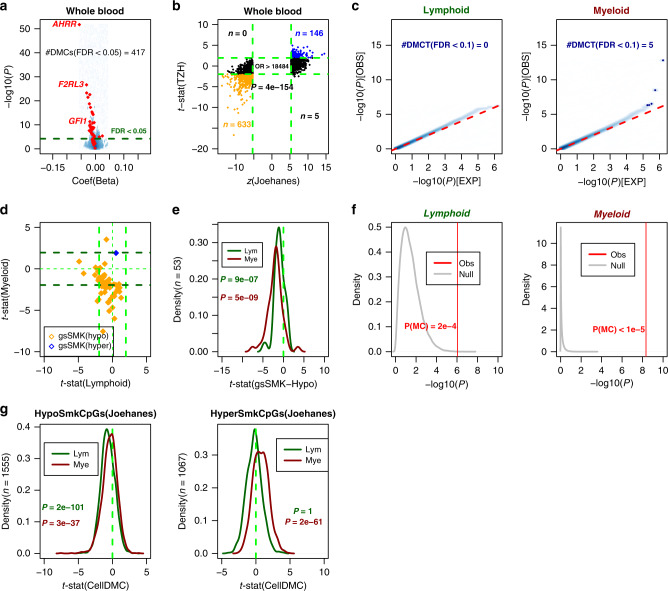
Fig. 1. Blood lineage specific smoking-associated DNAm changes in TZH cohort.
a Volcano scatterplot for 811,902 CpGs displaying the estimated coefficient (x-axis) and −log10P value (y-axis) derived from a linear model of DNAm against smoking status. Dashed line denotes FDR = 0.05, and in red we highlight the set of 62 gold-standard smoking-associated CpGs. The number of DMCs passing FDR < 0.05 is given. b Scatterplot of z-statistics of the 2622 smoking-associated CpGs from the meta-analysis of Joehanes et al. (x-axis) vs. their corresponding t-statistics in the TZH cohort. Odds ratio (OR) and one-tailed Fisher-test P value are given. Consistently hypermethylated and hypomethylated CpGs are shown in blue and orange, respectively. Vertical and horizontal green dashed lines represent the Bonferroni and FDR < 0.05 significance levels in the Joehanes and TZH, respectively. The number of CpGs in each significant quadrant are indicated by “n”. c Quantile–quantile plots displaying the results of CellDMC for the lymphoid and myeloid cell-types, as indicated. Red dashed line indicates the line where observed P values match the expected ones under the null-hypothesis of no global association between smoking and differential DNAm in the respective cell-type. Blue data points represent the DMCTs passing an FDR < 0.3 threshold. d Scatterplot of CellDMC-derived t-statistics of smoking-associated differential DNAm in lymphoid cell-type (x-axis) vs. the corresponding t-statistic in myeloid cell-type (y-axis). Dashed lines represent the P = 0.05 thresholds, and t = 0. In orange (blue) we depict the gold-standard smoking-associated CpGs that passed QC and that are hypomethylated (hypermethylated) in smokers. e Density distributions of CellDMC-derived t-statistics of smoking-associated differential DNAm in the TZH cohort for 53 gold-standard smoking hypomethylated CpGs in the lymphoid and myeloid lineages, as indicated. P value derives from a one-tailed Wilcoxon test, testing that these gold-standard CpGs do exhibit a significant trend toward hypomethylation. f Monte-Carlo significance analysis of hypomethylation trends for the 53 gold-standard hypomethylated smoking-CpGs. Density plots of the −log10P values derived from a one-tailed Wilcoxon rank sum test to determine if the t-statistics of association between DNAm and smoking of 53 randomly selected CpGs is significantly less than zero, for a total of 100,000 Monte-Carlo runs (“Null”, gray). The vertical red line indicates the corresponding one-tailed P value for the 53 gold-standard hypomethylated smoking-CpGs from Gao and Brenner. P values in red are derived from the Monte-Carlo analysis. All the data in this figure derives from analysis in our Chinese cohort. g Density distributions of CellDMC-derived t-statistics of smoking-associated differential DNAm in the TZH cohort for the 2622 gold-standard smoking CpGs from Joehanes et al in the lymphoid and myeloid lineages, as indicated. The 2622 CpGs have been split according to hypo (left) or hypermethylation (right) in the Joehanes meta-analysis study. P values derive from a one-tailed Wilcoxon test, testing that these gold-standard CpGs do exhibit a significant trend towards hypo-or-hypermethylation, as required.

