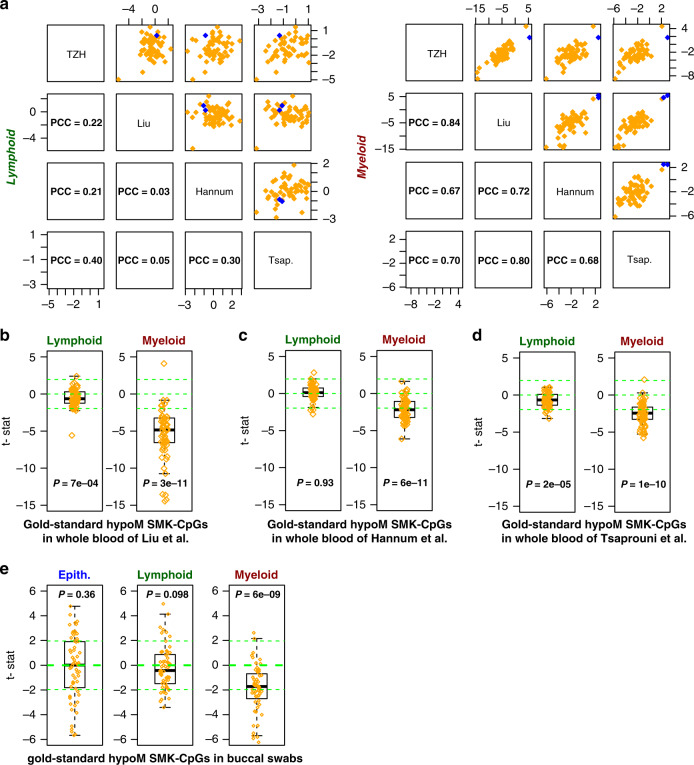
Fig. 2. Cell-type specific smoking-associated DNAm patterns of gold-standard smoking CpGs in independent cohorts.
a Scatterplots of cell-type specific t-statistics (as obtained with CellDMC) across four whole blood cohorts (TZH, Liu, Hannum, and Tsaprouni) with associated Pearson Correlation Coefficient (PCC) values, and separately for the lymphoid (left) and myeloid (right) lineages. The t-statistics are displayed for the 62 gold-standard smoking-associated CpGs (60 hypomethylated (orange) and 2 hypermethylated (blue)). b Boxplots of t-statistics of association of DNAm with smoking in the whole blood (n = 689) from Liu et al., as derived with CellDMC for both lymphoid and myeloid lineages. Boxplots only display the 60 gold-standard smoking hypomethylated CpGs from Gao and Brenner. P value derives from a one-tailed Wilcoxon rank sum test. Horizontal line within boxes indicate median, box-boundaries the interquartile range, and whiskers extend to 1.5 times this range. c–e As b, but now for the 656 samples from Hannum et al., the 464 samples from Tsaprouni et al., and the 790 buccal swab samples.

