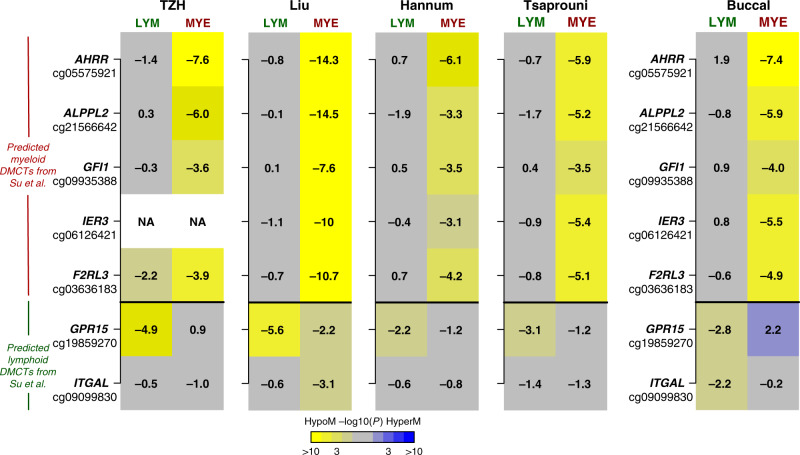
Fig. 3. Validation of CellDMC’s predictions.
Heatmaps of myeloid and lymphoid significance P values, as derived from CellDMC, in five separate cohorts and for a panel of seven CpGs which Su et al. showed to exhibit myeloid and lymphoid specific hypomethylation in smokers. The first four cohorts are whole blood samples. Significance of P values is denoted by color, and the corresponding t-test statistic values are displayed in the heatmap. P values derive from the t-test in the CellDMC model and are two-tailed.

