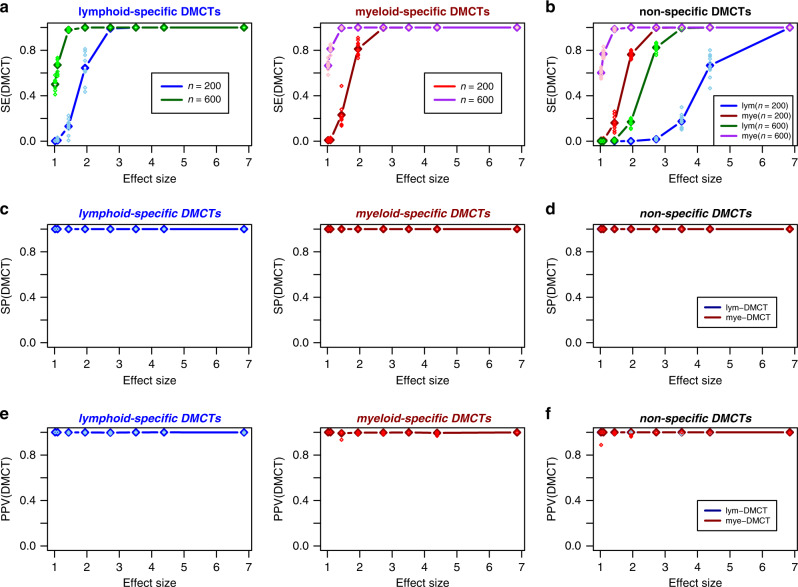
Fig. 5. Simulation-based power estimates for detecting lymphoid and myeloid DMCTs.
a Plot of the sensitivity to detect lymphoid and myeloid specific DMCTs (y-axis) vs. the smoking effect size (x-axis). Data points represent the mean sensitivity, as obtained over 10 different Monte-Carlo simulations, encompassing 482,077 CpGs of which 1000 are DMCTs. Darkblue/darkred datapoints are for n = 200 (100 cases and controls), darkgreen/purple are for n = 600 (300 cases and controls). Each sample is an in silico mixture of real DNAm profiles representing one purified CD4+ T-cell and one monocyte sample. For each case sample, 1000 DMCTs at the given average effect size in only one of the two cell-types was generated. The sensitivities for each of the ten Monte-Carlo runs are shown in skyblue/red. b As a, but now for the scenario where the DMCTs are introduced at the same CpG in both cell-types. Sensitivity to detect the DMCT in the lymphoid and myeloid lineage is shown. c, d As a, b, but now for the specificity. e, f As a, b, but now for the precision or positive predictive value (PPV). Specificity and PPV values for both choices of sample size are effectively identical.

