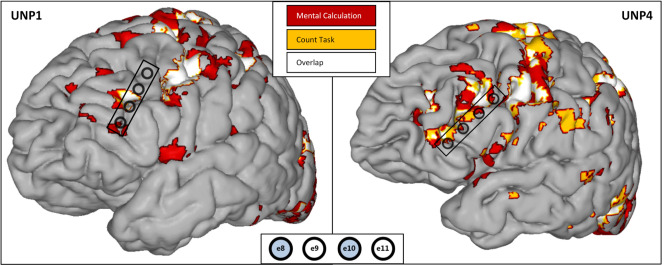
Figure 1.
fMRI results and electrode strip location. T-maps from the mental calculation task (red), count task (orange), and their functional overlap (white) from both participants (left: UNP1, right: UNP4) plotted on their anatomical T1 weighted images (method from21, supplementary materials). Applied thresholds: UNP1: t > 10 for both tasks; UNP4: t > 7 and t > 3 for mental calculation and count task, respectively; voxel depth 8 mm. Strip and electrodes placed over the left-dlPFC are indicated in black on the brain surface. Electrode numbers are indicated at the bottom of the figure, e8 being the most frontal and inferior electrode in both participants. Electrodes used for control in both participants are indicated in light blue. In our visualization software, different colors are represented numerically (1–3 for mental calculation task, count task, and the overlap, respectively) and edge colors take one value lower: hence the different edge colors for different activation maps in these plots.

