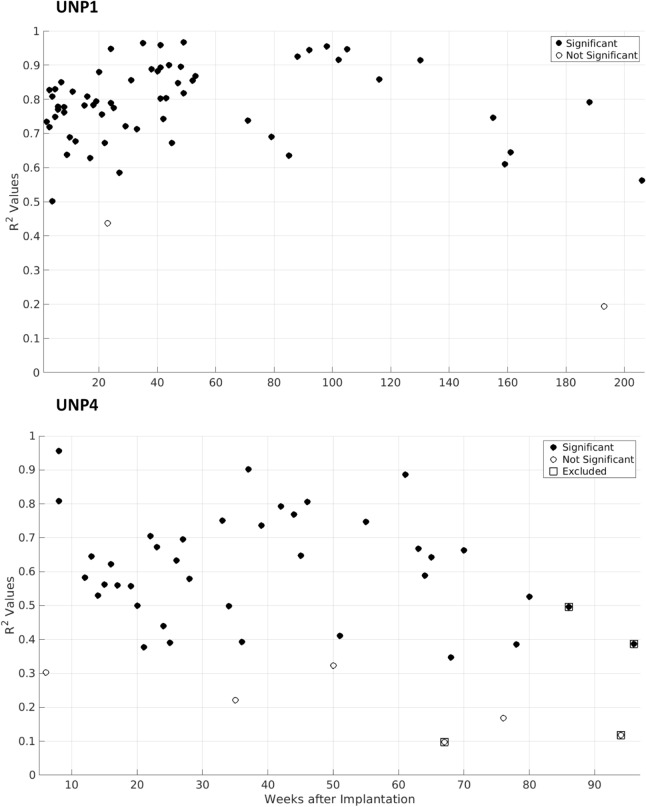
Figure 4.
Signed r2 values from control pair e8–e10. For UNP1 (top) and UNP4 (bottom), the signed r2 values between HFB power (65–95 Hz) and count task conditions from all runs with pair e8–e10 are plotted, with weeks since implantation on the x-axis. Y-axis runs from 0 to 1, because no r2 value from pair e8–e10 fell below 0. Black dots indicate significant HFB activation during active blocks (α = 0.05; p values not corrected). Because task duration was varied and p values are influenced by sample size (i.e. the number of blocks), the statistical significance of specific r2 values may vary (e.g. UNP1′s 0.44 in week 23 is not significant, even though UNP4′s 0.39 in week 21 is). Runs from UNP4 recorded during high fatigue are indicated by squares and were removed from final linear regression. Values from electrode pair e8–e10 from Fig. 3 are included in this figure.

