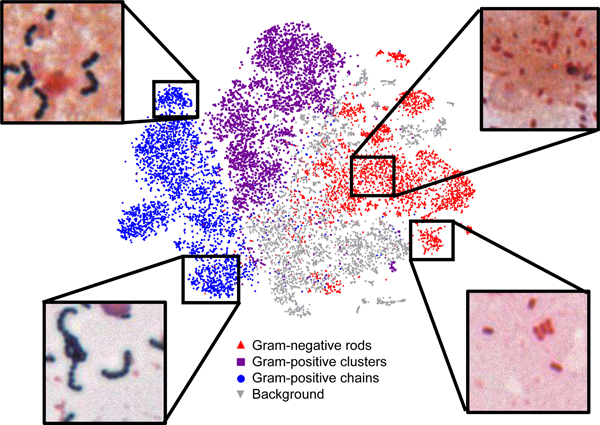
Figure 1. Two-dimensional representation of Gram-stain classifications highlights ability to further subcategorize data.
Here, a t-statistic nearest neighbor embedding (tSNE) algorithm was used to visualize Gram-stain crop classification data in two-dimensions. Clusters of Gram-positive cocci in long (left, lower) or short chains (left, upper) are readily recognizable. Similarly, Gram-negative rods (right, lower) can be distinguished from coccobacilli (right, upper). This information could later be used to provide additional probabilistic subclassification of organisms.

