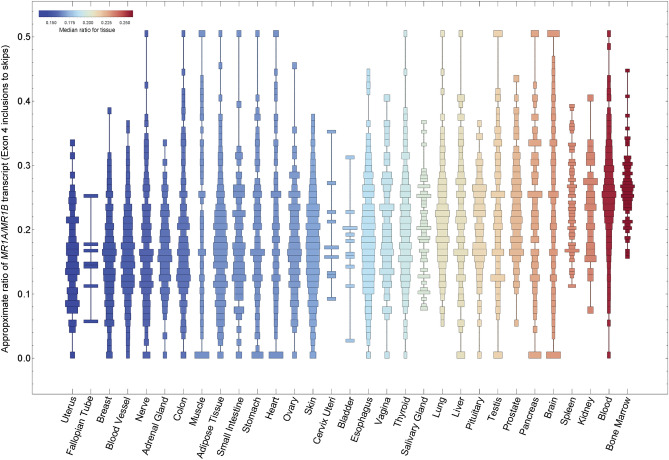
Figure 1.
Distribution of relative MR1A/MR1B transcript across the GTEx dataset. Snaptron was used to query human transcriptome data from the publicly available GTEx dataset of non-malignant human tissues. Relative MR1A/MR1B mRNA expression was measured by quantifying junctional inclusion ratios of exon 3 inclusions (MR1A) to exon 3 skips (MR1B). We depict histograms of the ratio of MR1A/MR1B transcript expression in order of increasing mean expression.

