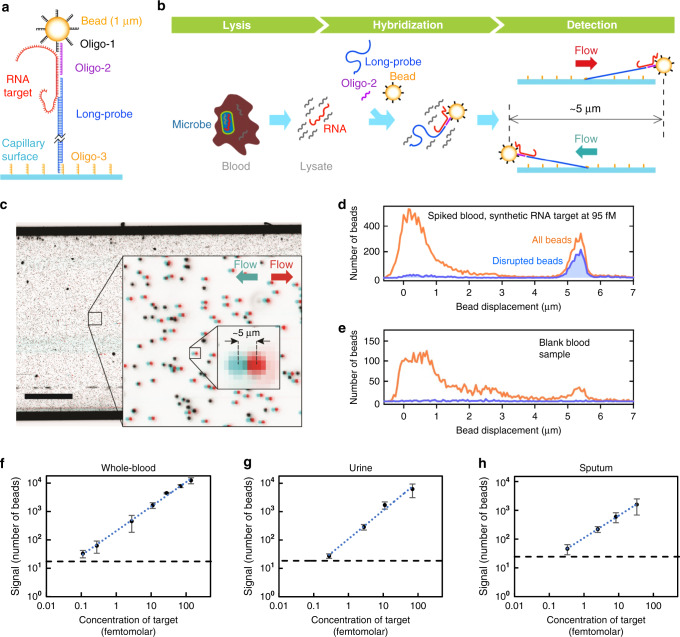
Fig. 1. SMOLT technology design and validation.
a SMOLT biosensor design. Superparamagnetic beads are functionalized with a DNA Oligonucleotide (Oligo-1). Oligo-2 has a section complementary to Oligo-1, and a section complementary to the target. The Long Probe (>3 kb pairs) is mostly double-stranded with single-stranded ends. One end is complementary to the target while the other is complementary to an oligonucleotide chemically linked to the capillary (Oligo-3). b The SMOLT assay protocol consists of body fluid lysis, incubation with probes and beads, and capillary detection where beads are imaged with flow in opposite directions. c Superposition of two false-color capillary images exemplify SMOLT bead displacement determination. The red image was obtained with flow in one direction and the blue obtained with flow in the opposite direction. The displacement of a bead is its change of position between the two images. Non-displaced beads appear black. Similar images were obtained in each bead displacement analysis of this study, n > 200. Scale bar, 1 mm. d, e Histograms of bead displacement. The orange line histograms include the displacement of all the beads in the imaged area. The blue line histograms only include the displacement of disrupted beads (see text). Human whole blood d spiked with target, e not spiked (blank). Detection of synthetic RNA target spiked into human f whole blood, g urine, h sputum. The cutoffs (black dashed line) were defined as the mean plus two times the standard deviation (SD) of blank sample signals in the corresponding body fluid. The dotted blue line in each panel is a linear function fitted to the data. Data are represented as mean ± SD. Number of experiments in whole blood were n = 5, 4, 6, 3, 3, 3, 3 for concentrations 0.11, 0.28, 2.77, 11.07, 27.68, 69.19, 138.38 fM, respectively. Number of experiments in urine were n = 4, 3, 3, 3 for concentrations 0.27, 2.77, 11.07, 69.19 fM, respectively. Number of experiments in sputum were n = 4, 3, 4, 3 for concentrations 0.33, 2.49, 8.30, 33.21 fM, respectively. Source data are provided as a Source Data file.

