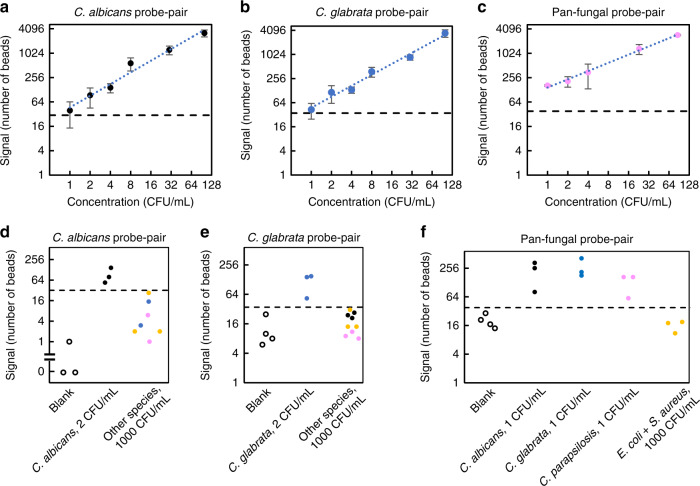
Fig. 2. SMOLT detection of Candida in human whole blood.
Human whole blood samples were spiked with Candida cells at indicated concentrations. a–c Detection of Candida across the range of clinical concentrations. Data plotted on Log2 scale for both axes. The signal increased with increasing concentrations. The dotted blue line in each panel is a linear function fitted to the data. Data are represented as mean ± SD, n = 3 independent experiments. a C. albicans probe pair detecting C. albicans (R2 = 0.9731). b C. glabrata probe pair detecting C. glabrata (R2 = 0.9831). c Pan-fungal probe pair detecting C. parapsilosis (R2 = 0.9958). The cutoffs (black dashed line) were defined above the mean plus two times the SD of the blank samples signal for each probe pair. LOD and cross-reactivity of the d C. albicans probe pair; e C. glabrata probe pair; and f pan-fungal probe pair. Blank samples (empty circles), C. albicans (black circles), C. glabrata (blue circles), C. parapsilosis (pink circles) and E. coli plus S. aureus (yellow circles). The LOD was defined as the concentration for which three measurements were above cutoff with no measurement below cutoff. At each LOD concentration, the signal was significantly different from the blank signal, each with p < 0.05. Unpaired two-tailed Student’s t test was used for comparing two concentrations and p values are d p = 0.028, e p = 0.011, f p = 0.022 for C. albicans, p = 0.0097 for C. glabrata, p = 0.014 for C. parapsilosis using pan-fungal probe pair. Samples spiked with E. coli plus S. aureus had 1000 CFU mL−1 of each species. Source data are provided as a Source Data file.

