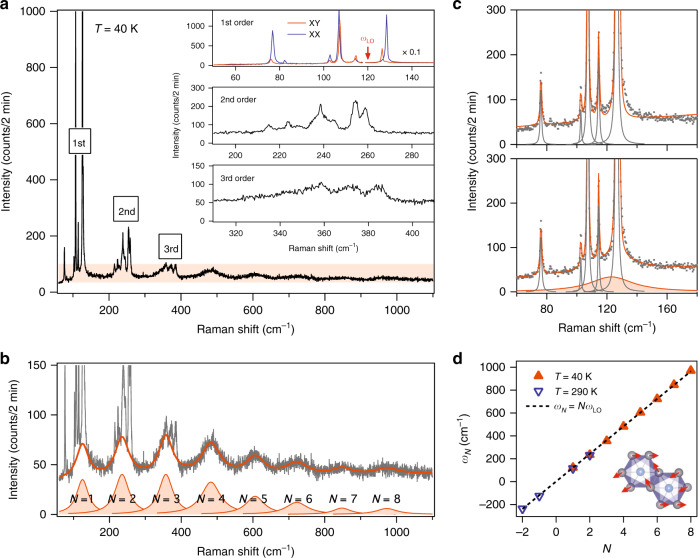
Fig. 2. Polaronic character of exciton dynamics in bilayer CrI3.
a Raman spectrum of bilayer CrI3 acquired in the linearly crossed polarization channel at 40 K using a 633 nm laser. Insets show 1st-order single-phonon modes (linear parallel/crossed, i.e., XX/XY, channel in blue/red), 2nd-order two-phonon modes, and 3rd order three-phonon modes. The red arrow indicates the Raman-inactive longitudinal optical (LO) phonon frequency of importance, . The spectral intensities in the frequency range above 118 cm−1 are scaled by a factor of 0.1. b Zoom-in of the orange shaded area in the spectrum in a. The solid orange line overlaid on the raw data is the fit to the periodic pattern in the Raman spectrum with a sum of eight Lorentzian profiles indexed from N = 1 to N = 8 and a constant background, i.e., . c Fit of the Raman spectrum over the 1st-order spectral range without (upper panel) and with (lower panel) the consideration of the N = 1 broad mode (shaded Lorentzian profile in the lower panel). d Plot of the fitted central frequency () of the Nth Lorentzian profile in data taken at 40 K (solid orange triangle) and 290 K (hollow blue triangle). Dashed line is a linear fit () to the plot that yields a slot of cm−1. Inset shows the atomic displacement of the LO phonon mode.

