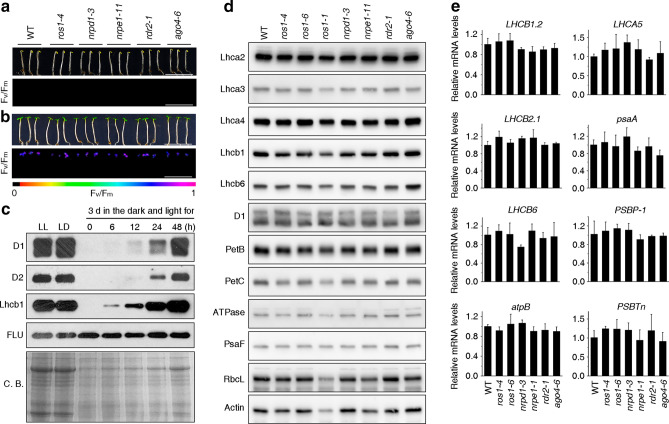
Figure 3.
Photomorphogenesis is not significantly affected in ros1, nrpd1, nrpe1, rdr2 or ago4 mutant seedlings. (a) Phenotypes (upper panel) and the corresponding maximum quantum yields of PSII (Fv/Fm) (lower panel) of 4-day-old etiolated seedlings. Fv/Fm was measured with an imaging Chl fluorometer (Imaging PAM). Scale bar = 1 cm. (b) Phenotypes (upper panel) and corresponding Fv/Fm values (lower panel) of 3-day-old etiolated seedlings which had been exposed to continuous light for 24 h. (c) Immunoblot analysis of the PSII core proteins (D1 and D2), Lhcb1 and FLU during greening of etiolated seedlings. WT seedlings were grown for 3 days in the dark and exposed to light for between 0 and 48 h, as indicated. Extracted total proteins were normalized with respect to fresh weight and fractionated by SDS-PAGE. Blots were then probed with antibodies raised against the individual proteins. Total proteins from 5-day-old WT seedlings grown under continuous light (LL) and LD conditions (LD) were used as positive controls. The total protein accumulation of each sample was visualized by staining the gel with Coomassie Blue R250 (C.B.). The figure was assembled from different blots (delineated by a black rectangle) and full-length blots are presented in Supplementary Fig. S7. (d) Immunoblot analysis of representative photosynthesis proteins of 3-day-old etiolated mutant seedlings which had been exposed to continuous light for 24 h. Immunoblot analysis was performed as in (c). The figure was assembled from different blots (delineated by a black rectangle) and full-length blots are presented in Supplementary Fig. S8. (e) Real-time PCR analyses of 3-day-old etiolated WT (Col-0) and mutant seedlings that had been exposed to continuous light for 24 h. Real-time PCR was performed with primers specific for the nuclear genes LHCB1.2, LHCB2.1, LHCB6, LHCA5, PSBP-1 and PSBTn, and the plastid genes psaA and atpB. Note that the primers for LHCB2.1 also amplify LHCB2.2 mRNA. Expression values are reported relative to the corresponding transcript levels in the WT and were normalized with respect to the expression level of ACTIN2. Data are shown as mean values ± SD from three different plant pools.

