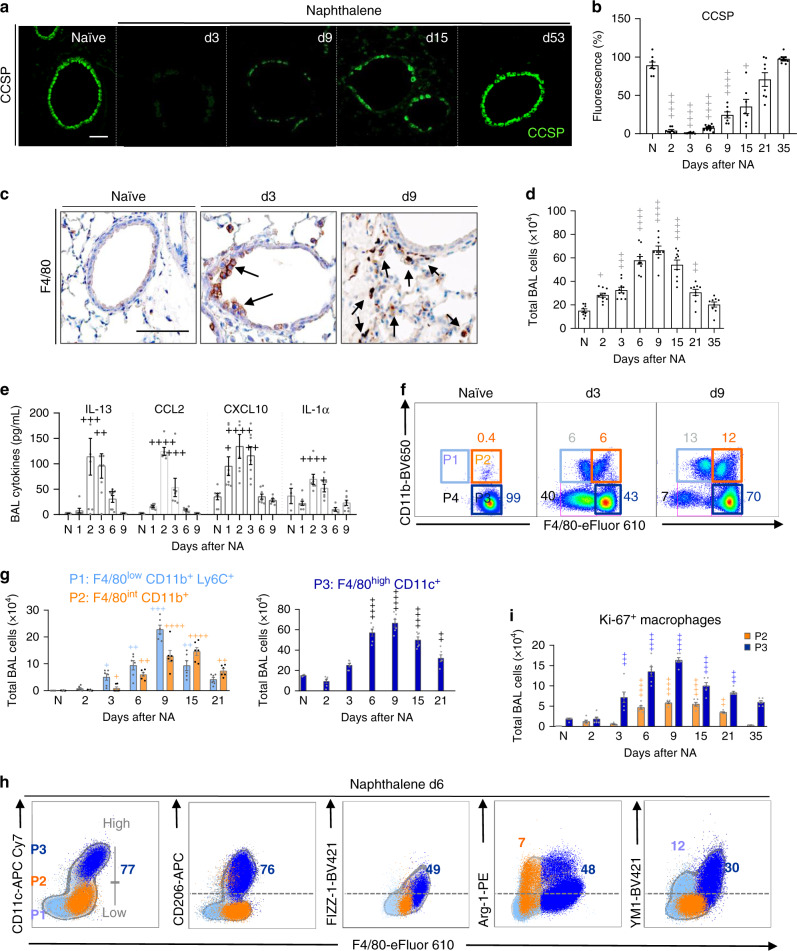
Fig. 1. Macrophages predominate during epithelial repair and exhibit AAM phenotype.
a–i WT C57BL/6 mice were untreated (naïve, N) or treated with naphthalene (NA) and analyzed at various days thereafter. a Bronchiolar epithelium regeneration after NA-induced injury, as assessed by immunofluorescence staining of CCSP in lung tissue sections. b Quantification of CCSP expression in lung tissue sections from naïve and NA-treated mice, expressed as percentage of fluorescence within bronchioles (150–400 µm diameter), at the indicated time-points after NA. c Immunohistochemical analysis of F4/80 expression (brown deposit) illustrating macrophage localization (black arrows) around the injured bronchiolar epithelium in lung tissue sections. d Quantification of the total number of cells in the bronchoalveolar lavage (BAL). e Levels of IL-13, CCL2, CXCL10, and IL-1α in BAL supernatants. f Monocyte/macrophage subsets (P1–P4). Inflammatory monocytes F4/80low CD11b+ (P1), recruited macrophage F4/80int CD11b+ (P2), resident macrophages F4/80high CD11b− (P3) and apoptotic macrophages Annexin V+ F4/80low CD11b− (P4) in the BAL are defined by their gates in (f). g Total cell numbers of P1–P3 subsets at the indicated time-points after NA administration. h Representative FACS profiles of BAL cells obtained on d6 after NA, illustrating the expression of CD206, FIZZ-1, YM1, and Arg-1 in P1–P3 BAL cell subsets, respectively. i Quantification of BAL macrophage proliferation as assessed by FACS analysis on P2 and P3 subsets, using Ki-67 staining. Data are from 8 (a–e) and 6 (g, i) mice, obtained in 3 independent experiments, and represented as mean ± SEM. *P < 0.05, **P < 0.01, ***P < 0.001 and ****P < 0.0001 between NA-treated and naïve WT mice using one-way ANOVA, Bonferroni post-test. Scale bars in a and c = 100 µm.

