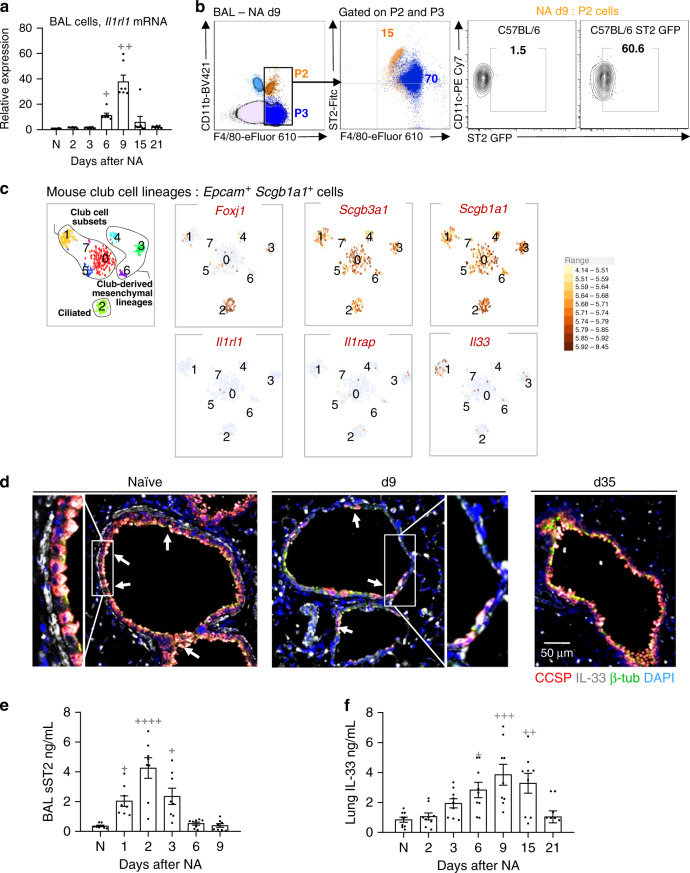
Fig. 4. IL-33-ST2 axis is activated in airway macrophages during bronchial re-epithelialization.
a Relative mRNA expression of Il1rl1 as determined by qPCR for total BAL macrophages. b FACS quantification as percentage of ST2 expression on P2 and P3 cells of total cells in BAL. Results were confirmed using GFP ST2 reporter mice in the right panel. c Single-cell RNA-sequencing analysis of mouse naïve bronchial epithelial lineages showing t-SNE plots of club cell lineages as identified by Scgb1a1 and Scgb3a1. Clusters 0, 1, 5, and 7 represent club-epithelial lineages subsets. Gene expression plots demonstrating expression of IL-33 in a proportion of club cells (Cluster 1). High expression of Foxj1 in Cluster 2 identifies club-derived ciliated cell. Other clusters (3, 4, and 6) are club-derived mesenchymal lineages. Scale bar to the right denotes normalized gene expression level of marker’s gene for each cell. d Representative sections from histological staining of CCSP (red), IL-33 (white), β-tubulin (green), and nuclear content (DAPI, blue) in lung sections. White arrows indicate IL-33-containing club cells. e soluble ST2 (sST2) levels in the BAL supernatants. f Levels of IL-33 in homogenized lung samples. Data from n = 7 (a, d), 8 (e), and 9 (f) mice are representative of at least three independent series of experiments and show mean ± SEM. *P < 0.05, **P < 0.01, ***P < 0.001 and ****P < 0.0001 between NA-treated and naïve (N) WT mice using one-way ANOVA, Bonferroni post-test. Scale bar in d = 50 µm. t-SNE (t-distribution stochastic neighbor embedding) plots in graph c show data from one experiment (n = 1).

