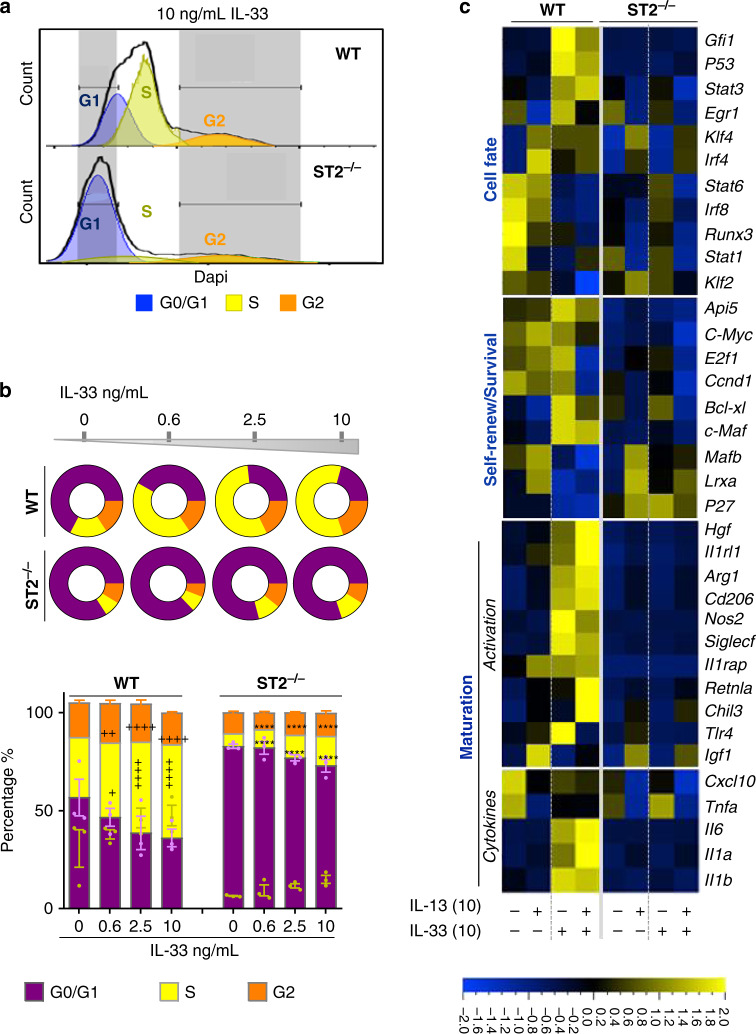
Fig. 7. ST2 controls macrophage cell cycle progression and activation in vitro.
a–c Bone marrow-derived cells were cultured in M-CSF alone (unstimulated) or cultured in the presence of M-CSF with varying concentrations of IL-13 and IL-33 for 3 days ex vivo. a Representative histograms from WT and ST2−/− BMDMs showing DAPI staining after fixation. Cell cycle phases (G0/G1, S, and G2) are gated by nuclear DNA content. b Quantification of BMDMs in the three cell cycle phases and shown in (a) and disc graphs denote mean only. c Heat-map constructed from Fluidigm analysis of mRNA transcripts for the denoted genes from cultured WT and ST2−/− BMDMs. Scale bar on the bottom denotes relative log2 differences in gene expression for each row. Samples are bone marrow treated and cultured separately from three individual mice per genotype. All bar graphs show means ± SEM. Data from n = 3 mice are representative from two independent experiments. *P < 0.05, **P < 0.01, ***P < 0.001 and ****P < 0.0001 between indicated IL-33-treated and unstimulated BMDMs. *P < 0.05, **P < 0.01, ***P < 0.001 and ****P < 0.0001 between IL-33-stimulated ST2−/− and WT BMDMs using two-way ANOVA, Bonferroni post-test.

