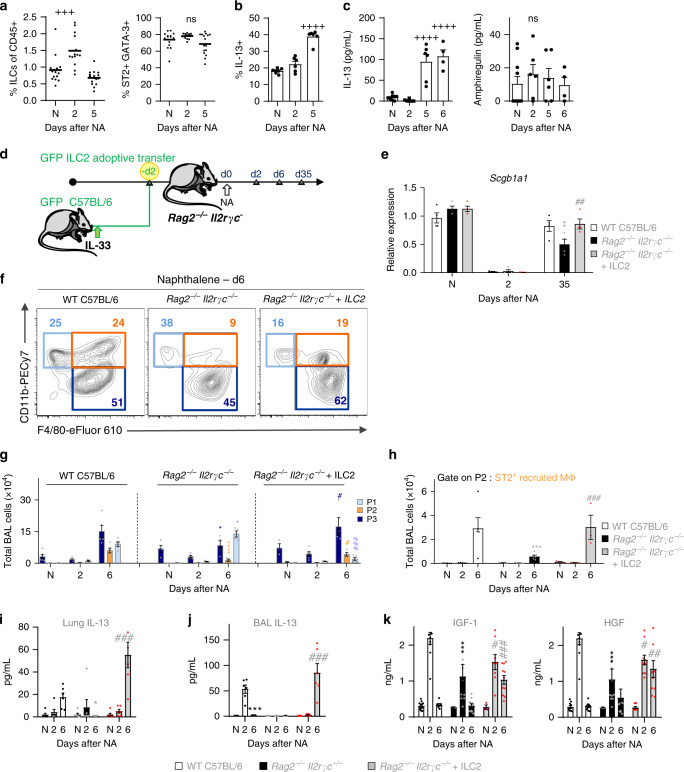
Fig. 9. Lung ILC2s produce IL-13 after NA injury and contribute to macrophage maturation.
a–c Quantification of the frequency of ST2+ GATA-3+ expressing ILCs (a) found in the lung at days 0, 2, and 5 after NA-treatment; N = naïve. ILCs were isolated from the lungs of mice on days 0, 2, 5, and 6 post-NA-treatment and stimulated ex vivo, then flow-stained for IL-13 production and quantified as frequency (b). IL-13 and amphiregulin production were quantified also in stimulated ILC supernatants (c). d Schematic for the transfer of lung ILC2s into Rag2−/−/Il2rγc−/− recipient mice followed by naphthalene administration (Rag2−/−/Il2rγc−/− + ILC2). e Levels of the Scgb1a1 mRNA in total lung homogenates in WT C57BL/6 or Rag2−/−/Il2rγc−/− mice that adoptively received GFP+ ILC2s (Rag2−/−/Il2rγc−/− + ILC2). f Representative flow cytometric plots of P1-P3 subsets of BAL cells from WT C57BL/6 or Rag2−/−/Il2rγc−/− mice that adoptively received GFP+ ILC2s (Rag2−/−/Il2rγc−/− + ILC2). Numbers nears gates denote percentage. g Quantification of total P1–P3 cells in BAL using the gating strategy in (f). h Quantification of the total number of ST2-expressing recruited macrophages (ST2+ P2 recruited macrophages) in the BAL. i Levels of IL-13 in lung homogenates. j, k Levels of IL-13 (j) and IGF-1 and HGF in BAL supernatants (k). Data from n = 15 (a), 6 (b), 3 to 9 (c), 4 (e), 5 (f–h), 6 (i, j), and 8 (k) mice, show mean ± SEM pooled from three independent experiments. ***P < 0.001 and ****P < 0.0001 between NA-treated and naïve (N) WT mice using one-way ANOVA, Bonferroni post-test. *P < 0.05, **P < 0.01, ***P < 0.001 and ****P < 0.0001 between NA-treated Rag2−/−/Il2rγc−/− and WT mice using one-way ANOVA, Bonferroni post-test (a–c). #P < 0.05, ##P < 0.01 and ###P < 0.001 between AAM adoptively transferred and NA-treated ST2−/− mice using one-way (g–k) and two-way ANOVA (e), Bonferroni post-test.

