Figure 4.
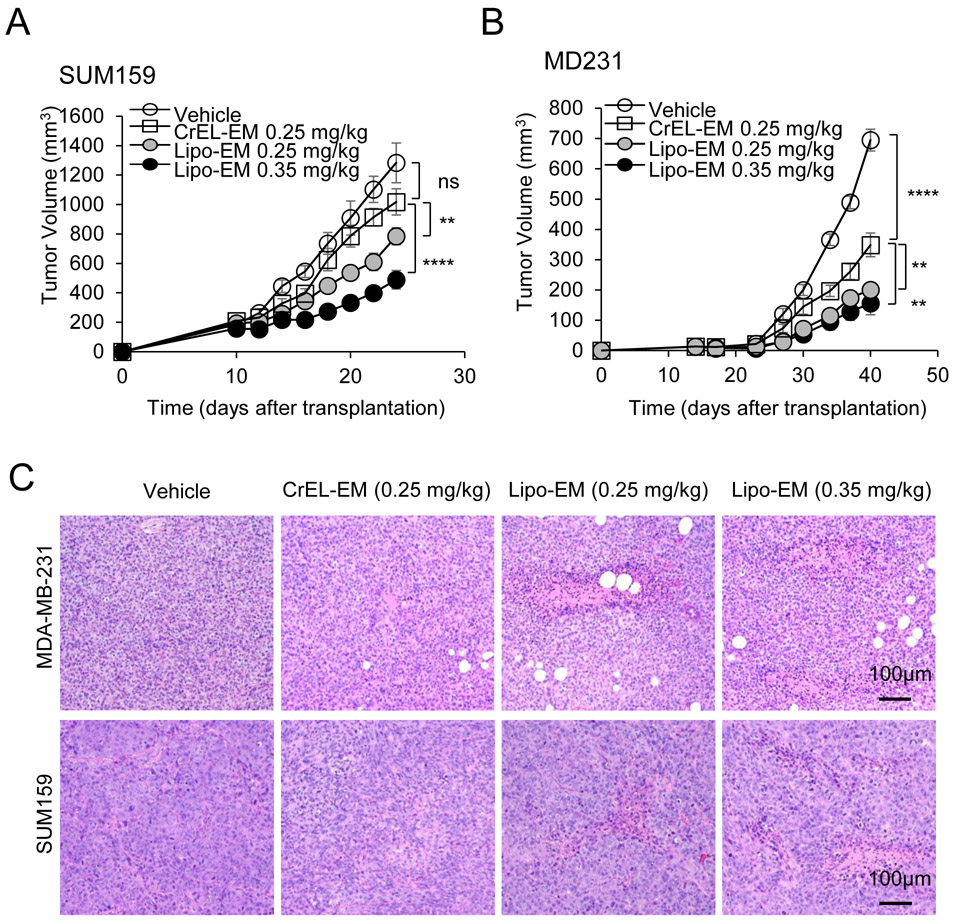
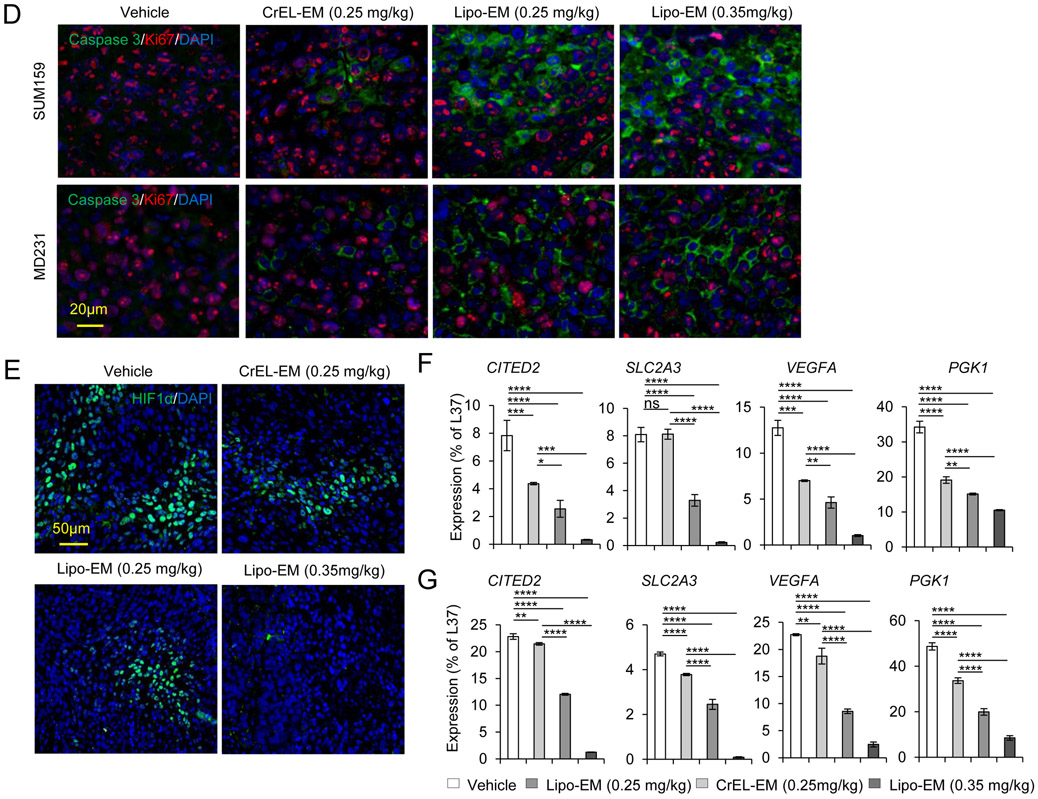
Liposomal-echinomycin Is More Effective than CrEL-Echinomycin. A&B) Female NSG mice were injected with 1.0x10⁶ SUM-159 (A) or MDA-MB-231 (B) cells. Treatment was initiated when tumors measured 3x3 mm, on day 10 (SUM-159) or day 14 (MDA-MB-231). Mice were randomized (n=7 mice/group) to receive vehicle, CrEL-echinomycin or liposomal-echinomycin, once every three days for 5 doses. Mean tumor volumes shown; P-values indicate CrEL-echinomycin 0.25 mgkg−1 vs liposomal-echinomycin (0.25 mgkg−1 and 0.35 mgkg−1) groups. SUM-159 or MDA-MB-231 xenograft mice were euthanized on days 25 or 40, respectively, and tumor, liver and lung tissues were formalin-fixed. C) Tumor tissues were H&E stained to detect necrotic regions in SUM-159 and MDA-MB-231 tumor tissues. D) Representative immunofluorescence staining of Ki67 and cleaved-caspase 3 protein and 4,6-diamidino-2-phenylindole (DAPI) in fixed primary tumor tissues from SUM-159 or MDA-MB-231 xenograft mice. E) Representative immunofluorescence staining of HIF-1α protein and DAPI in fixed primary tumor tissues from SUM-159 xenograft mice. F&G) mRNA expression of HIF-1α target genes in primary tumor cells from SUM-159 (F) and MDA-MB-231 (G) xenograft mice treated with different dose/formulation of echinomycin or vehicle. mRNA was isolated from tumors of 5 mice/group and cDNA was pooled for each group prior to analysis by qPCR. Mean expression ± SEM is shown, normalized to L37. P-values annotated beside CrEL-echinomycin indicate comparison with vehicle; those beside liposomal-echinomycin indicate comparison with CrEL-echinomycin.


