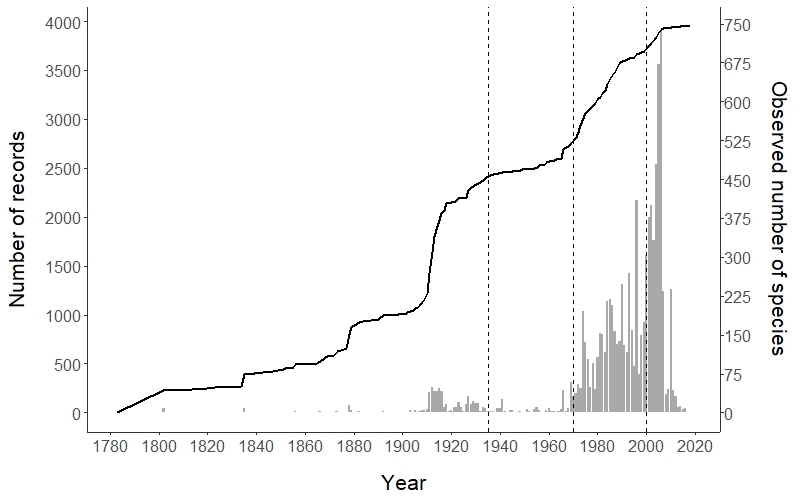
Figure 3.

Historical progression of moss surveys in the Iberian Peninsula. Number of moss records gathered each year (grey bars) and accumulated number of species recorded in IberBryo (black line). Vertical dashed lines define different periods of historical data collection.
