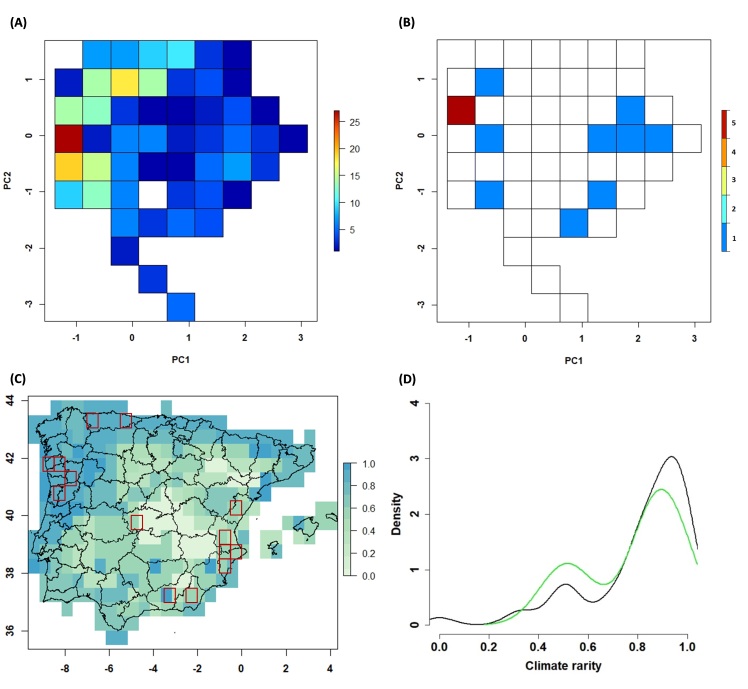
Figure 7.
Climatic coverage of Iberian moss surveys. (A) Frequency of climate types in the Iberian environmental space (values indicate the number of 30’ cells of each climate type). (B) Frequency of climate types covered by well-surveyed cells (values indicate the number of 30’ cells of each climate type). (C) Geographic distribution of climatic rarity index in the study area (rarest climate types = 1), red squares indicate the location of well-surveyed moss cells. (D) Density comparison of the climatic rarity covered by Iberian cells (black line) and well-surveyed moss cells (green line).

