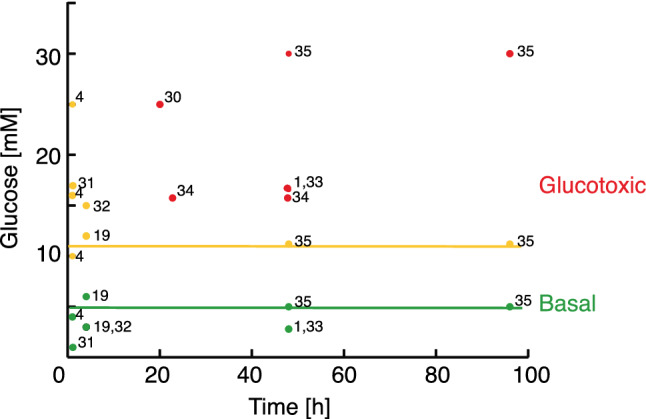
Figure 1.

Literature survey of insulin response to glucose loading in β-cells. Green represents basal blood glucose concentration (up to 5 mM); yellow represent glucose concentrations, where insulin response is increased compared to the basal condition. The yellow line is drawn at 11.7 mM glucose; red represents glucotoxic conditions where insulin secretion is reduced compared to the basal condition. Numbers refer to literature references. Additional information including cell line and incubation conditions for the referred studies are collected in Tab S1.
