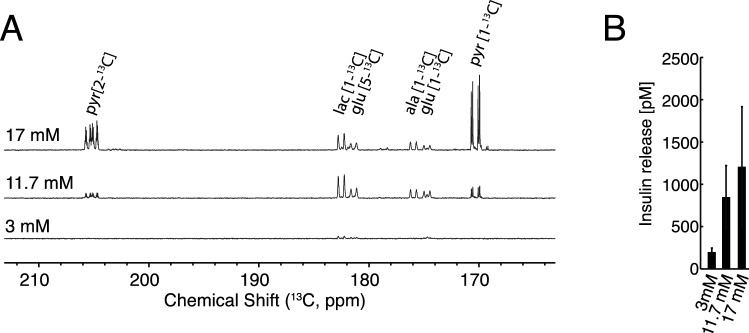
Figure 3.
(A) 13C NMR spectrum of hyperpolarized metabolites after 4 h of incubation with 3, 11.7 and 17 mM [U-13C,D] glucose. The metabolites were polarized for 90 min after which they were subjected to rapid dissolution in hot phosphate buffer. (B) Corresponding accumulated insulin ELISA on extract supernatant and cell lysate from 3–17 mM glucose, n = 4. A statistically significant increase in insulin release was found by regression analysis (adjusted R = 0.999; ANOVA analysis p = 0.016). Insulin content was also determined (Fig S2).

